| Red | Green | Blue | |
| z | 17.64 | ||
| znorm | Inf | ||
| sky | -Inf | -Inf | -NaN |
| S/N | 14.6 | 26.2 | 29.0 |
| S/N(c) | 0.0 | 0.0 | 0.0 |
| SN(E/C) |
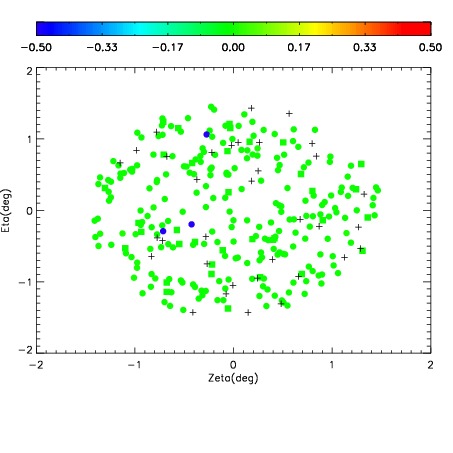
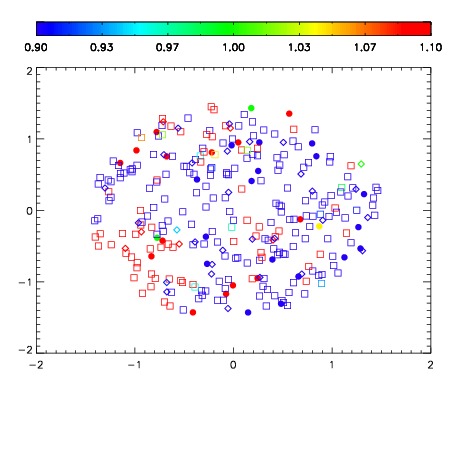
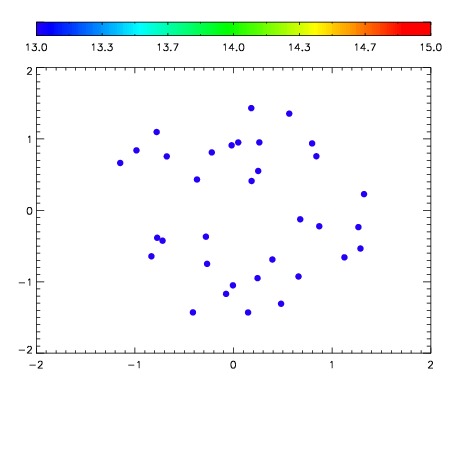

| Frame | Nreads | Zeropoints | Mag plots | Spatial mag deviation | Spatial sky 16325A emission deviations (filled: sky, open: star) | Spatial sky continuum emission | Spatial sky telluric CO2 absorption deviations (filled: H < 10) | |||||||||||||||||||||||
| 0 | 0 |
|
|
|
|
|
|
| IPAIR | NAME | SHIFT | NEWSHIFT | S/N | NAME | SHIFT | NEWSHIFT | S/N |
| 0 | 15450015 | 0.496277 | 0.00000 | 17.1555 | 15450013 | 0.00156334 | 0.494714 | 17.6063 |
| 1 | 15450011 | 0.495228 | 0.00104901 | 18.5368 | 15450010 | 0.00000 | 0.496277 | 18.5105 |
| 2 | 15450012 | 0.495609 | 0.000668019 | 17.6009 | 15450014 | 0.00169827 | 0.494579 | 17.8564 |