| Red | Green | Blue | |
| z | 17.64 | ||
| znorm | Inf | ||
| sky | -NaN | -Inf | -Inf |
| S/N | 22.4 | 37.6 | 42.4 |
| S/N(c) | 0.0 | 0.0 | 0.0 |
| SN(E/C) |
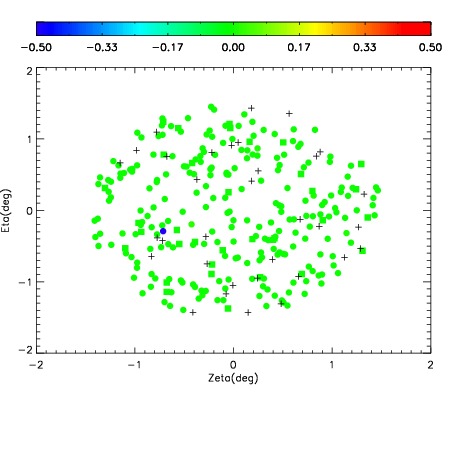
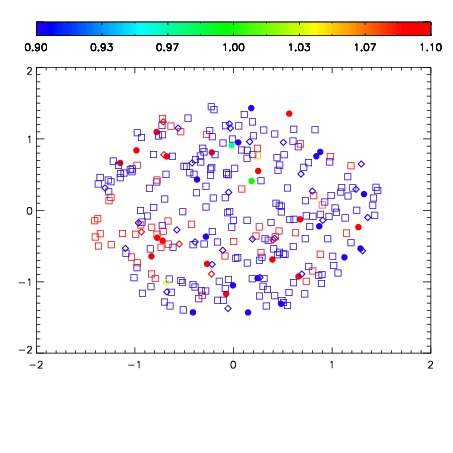


| Frame | Nreads | Zeropoints | Mag plots | Spatial mag deviation | Spatial sky 16325A emission deviations (filled: sky, open: star) | Spatial sky continuum emission | Spatial sky telluric CO2 absorption deviations (filled: H < 10) | |||||||||||||||||||||||
| 0 | 0 |
|
|
|
|
|
|
| IPAIR | NAME | SHIFT | NEWSHIFT | S/N | NAME | SHIFT | NEWSHIFT | S/N |
| 0 | 15590016 | 0.488781 | 0.00000 | 18.1762 | 15590015 | 0.00263831 | 0.486143 | 18.1193 |
| 1 | 15590012 | 0.486742 | 0.00203902 | 18.8112 | 15590011 | 0.00000 | 0.488781 | 18.7854 |
| 2 | 15590017 | 0.488112 | 0.000669003 | 18.6747 | 15590018 | 0.00274156 | 0.486039 | 18.6734 |
| 3 | 15590013 | 0.487813 | 0.000968009 | 18.0312 | 15590014 | 0.00281377 | 0.485967 | 18.1044 |