| Red | Green | Blue | |
| z | 17.64 | ||
| znorm | Inf | ||
| sky | -Inf | -Inf | -Inf |
| S/N | 7.5 | 15.4 | 17.1 |
| S/N(c) | 0.0 | 0.0 | 0.0 |
| SN(E/C) |
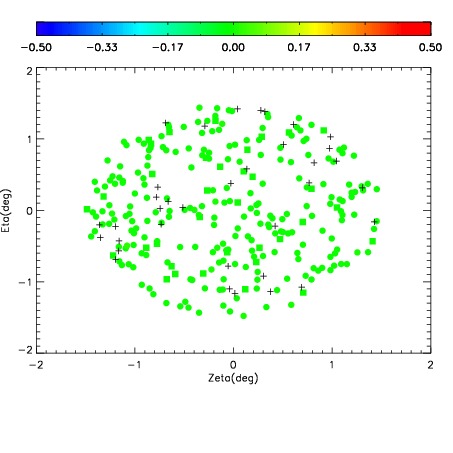
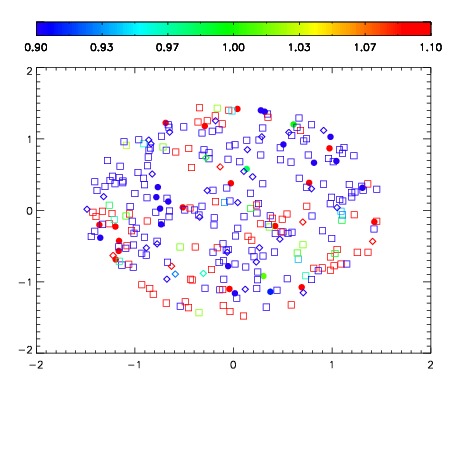
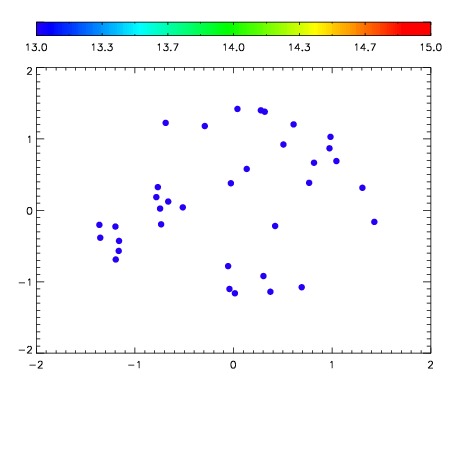

| Frame | Nreads | Zeropoints | Mag plots | Spatial mag deviation | Spatial sky 16325A emission deviations (filled: sky, open: star) | Spatial sky continuum emission | Spatial sky telluric CO2 absorption deviations (filled: H < 10) | |||||||||||||||||||||||
| 0 | 0 |
|
|
|
|
|
|
| IPAIR | NAME | SHIFT | NEWSHIFT | S/N | NAME | SHIFT | NEWSHIFT | S/N |
| 0 | 15430017 | 0.500677 | 0.00000 | 17.0655 | 15430019 | 0.00299144 | 0.497686 | 16.5103 |
| 1 | 15430030 | 0.499405 | 0.00127199 | 17.2947 | 15430018 | 0.00344928 | 0.497228 | 17.6797 |
| 2 | 15430016 | 0.500201 | 0.000476003 | 17.1207 | 15430015 | 0.00232093 | 0.498356 | 16.5852 |
| 3 | 15430025 | 0.498854 | 0.00182298 | 15.7682 | 15430029 | 0.00335547 | 0.497322 | 16.2864 |
| 4 | 15430020 | 0.497418 | 0.00325900 | 15.6914 | 15430014 | 0.00209475 | 0.498582 | 15.2476 |
| 5 | 15430012 | 0.498850 | 0.00182700 | 15.0025 | 15430022 | 0.00300416 | 0.497673 | 14.8258 |