| Red | Green | Blue | |
| z | 17.64 | ||
| znorm | Inf | ||
| sky | -Inf | -Inf | -Inf |
| S/N | 34.9 | 62.0 | 68.9 |
| S/N(c) | 0.0 | 0.0 | 0.0 |
| SN(E/C) |
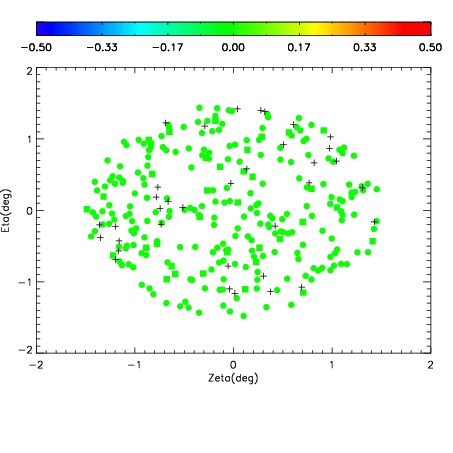
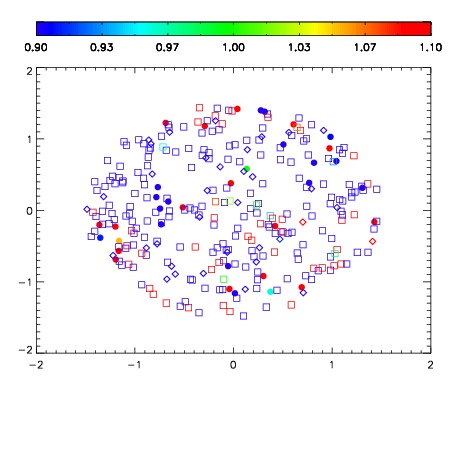


| Frame | Nreads | Zeropoints | Mag plots | Spatial mag deviation | Spatial sky 16325A emission deviations (filled: sky, open: star) | Spatial sky continuum emission | Spatial sky telluric CO2 absorption deviations (filled: H < 10) | |||||||||||||||||||||||
| 0 | 0 |
|
|
|
|
|
|
| IPAIR | NAME | SHIFT | NEWSHIFT | S/N | NAME | SHIFT | NEWSHIFT | S/N |
| 0 | 15440030 | 0.495265 | 0.00000 | 17.8847 | 15440031 | 0.000863299 | 0.494402 | 17.9538 |
| 1 | 15440033 | 0.493668 | 0.00159702 | 18.7687 | 15440039 | -0.00108698 | 0.496352 | 18.7794 |
| 2 | 15440038 | 0.491534 | 0.00373101 | 18.7018 | 15440032 | -3.26327e-05 | 0.495298 | 18.7022 |
| 3 | 15440045 | 0.491295 | 0.00397000 | 18.5698 | 15440044 | -0.00172267 | 0.496988 | 18.5862 |
| 4 | 15440046 | 0.491855 | 0.00341001 | 18.4429 | 15440047 | -0.000793103 | 0.496058 | 18.4940 |
| 5 | 15440049 | 0.494148 | 0.00111702 | 18.3620 | 15440048 | 9.22349e-05 | 0.495173 | 18.3874 |
| 6 | 15440042 | 0.491004 | 0.00426102 | 18.3199 | 15440043 | -0.000677584 | 0.495943 | 18.3561 |
| 7 | 15440050 | 0.494468 | 0.000797004 | 18.2794 | 15440051 | -0.000845216 | 0.496110 | 18.3029 |
| 8 | 15440041 | 0.490526 | 0.00473902 | 18.2631 | 15440040 | -0.00122671 | 0.496492 | 18.2561 |
| 9 | 15440037 | 0.492372 | 0.00289300 | 18.1627 | 15440036 | 0.00109994 | 0.494165 | 18.1208 |
| 10 | 15440034 | 0.494179 | 0.00108600 | 18.0053 | 15440035 | 0.00110360 | 0.494161 | 17.9923 |
| 11 | 15440029 | 0.494035 | 0.00123000 | 17.8156 | 15440028 | 0.00000 | 0.495265 | 17.8312 |