| Red | Green | Blue | |
| z | 17.64 | ||
| znorm | Inf | ||
| sky | -Inf | -Inf | -NaN |
| S/N | 21.9 | 45.7 | 50.5 |
| S/N(c) | 0.0 | 0.0 | 0.0 |
| SN(E/C) |

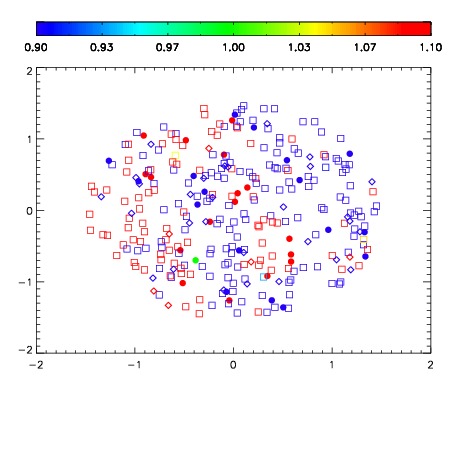


| Frame | Nreads | Zeropoints | Mag plots | Spatial mag deviation | Spatial sky 16325A emission deviations (filled: sky, open: star) | Spatial sky continuum emission | Spatial sky telluric CO2 absorption deviations (filled: H < 10) | |||||||||||||||||||||||
| 0 | 0 |
|
|
|
|
|
|
| IPAIR | NAME | SHIFT | NEWSHIFT | S/N | NAME | SHIFT | NEWSHIFT | S/N |
| 0 | 18420052 | 0.501516 | 0.00000 | 18.1309 | 18420054 | 0.000414913 | 0.501101 | 18.1893 |
| 1 | 18420059 | 0.501073 | 0.000442982 | 18.4442 | 18420053 | 0.000633125 | 0.500883 | 18.3751 |
| 2 | 18420060 | 0.500783 | 0.000732958 | 18.3864 | 18420058 | -0.000195769 | 0.501712 | 18.3549 |
| 3 | 18420051 | 0.501185 | 0.000330985 | 18.3100 | 18420061 | -0.00284428 | 0.504360 | 18.3421 |
| 4 | 18420055 | 0.500897 | 0.000618994 | 18.2905 | 18420050 | 6.08669e-05 | 0.501455 | 18.2910 |
| 5 | 18420056 | 0.501215 | 0.000301003 | 18.2594 | 18420049 | 7.57978e-05 | 0.501440 | 18.2223 |
| 6 | 18420047 | 0.500253 | 0.00126296 | 18.1920 | 18420057 | 0.000182013 | 0.501334 | 18.2008 |
| 7 | 18420063 | 0.499746 | 0.00176999 | 18.0176 | 18420046 | 0.00000 | 0.501516 | 18.1834 |
| 8 | 18420048 | 0.501320 | 0.000195980 | 17.9076 | 18420062 | -0.00231953 | 0.503835 | 18.0977 |