| Red | Green | Blue | |
| z | 17.64 | ||
| znorm | Inf | ||
| sky | -Inf | -Inf | -Inf |
| S/N | 19.8 | 37.0 | 42.0 |
| S/N(c) | 0.0 | 0.0 | 0.0 |
| SN(E/C) |
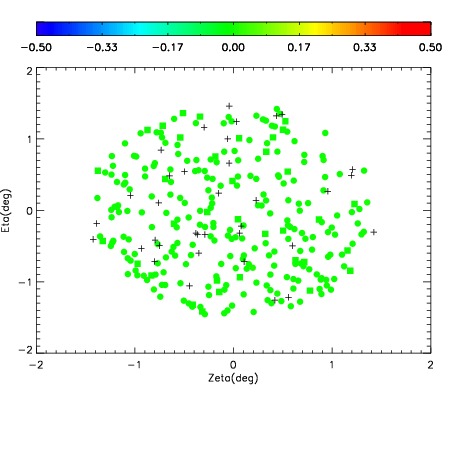
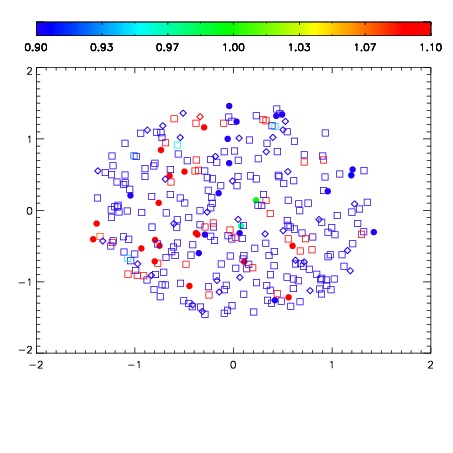
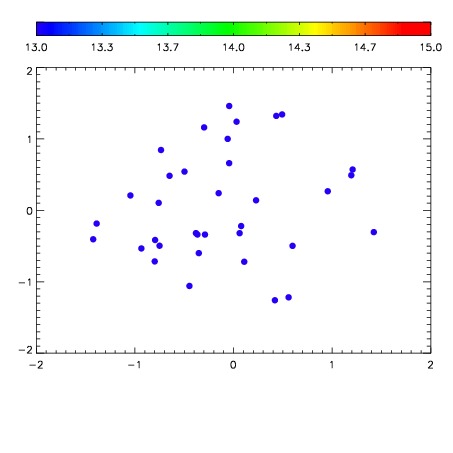

| Frame | Nreads | Zeropoints | Mag plots | Spatial mag deviation | Spatial sky 16325A emission deviations (filled: sky, open: star) | Spatial sky continuum emission | Spatial sky telluric CO2 absorption deviations (filled: H < 10) | |||||||||||||||||||||||
| 0 | 0 |
|
|
|
|
|
|
| IPAIR | NAME | SHIFT | NEWSHIFT | S/N | NAME | SHIFT | NEWSHIFT | S/N |
| 0 | 18370043 | 0.507867 | 0.00000 | 17.7435 | 18370042 | 0.00496254 | 0.502904 | 17.7829 |
| 1 | 18370044 | 0.507858 | 9.00030e-06 | 18.4173 | 18370041 | 0.00422419 | 0.503643 | 18.4724 |
| 2 | 18370035 | 0.503653 | 0.00421399 | 18.3760 | 18370045 | 0.00457117 | 0.503296 | 18.4574 |
| 3 | 18370040 | 0.505599 | 0.00226796 | 18.3370 | 18370034 | 0.00344401 | 0.504423 | 18.3445 |
| 4 | 18370039 | 0.504452 | 0.00341499 | 18.3152 | 18370038 | 0.00568748 | 0.502180 | 18.2573 |
| 5 | 18370032 | 0.504410 | 0.00345695 | 18.1406 | 18370033 | 0.00356204 | 0.504305 | 18.2213 |
| 6 | 18370028 | 0.503429 | 0.00443798 | 18.1405 | 18370029 | 0.00285970 | 0.505007 | 18.0774 |
| 7 | 18370027 | 0.503326 | 0.00454098 | 18.0537 | 18370030 | 0.00236968 | 0.505497 | 18.0182 |
| 8 | 18370031 | 0.503313 | 0.00455397 | 18.0324 | 18370026 | 0.00000 | 0.507867 | 17.9574 |
| 9 | 18370036 | 0.504414 | 0.00345296 | 17.9548 | 18370037 | 0.00592721 | 0.501940 | 17.9562 |