| Red | Green | Blue | |
| z | 17.64 | ||
| znorm | Inf | ||
| sky | -Inf | -Inf | -Inf |
| S/N | 16.8 | 29.1 | 35.9 |
| S/N(c) | 0.0 | 0.0 | 0.0 |
| SN(E/C) |
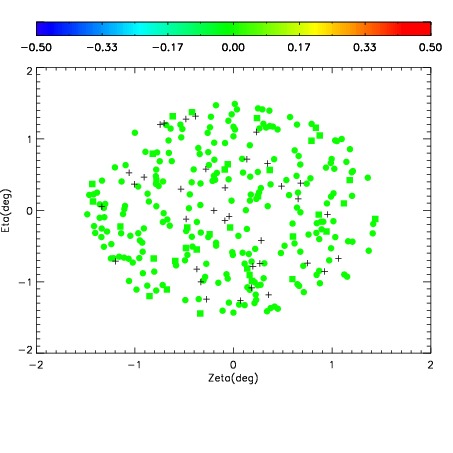
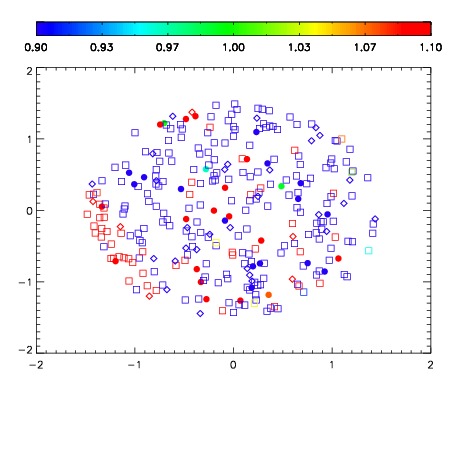
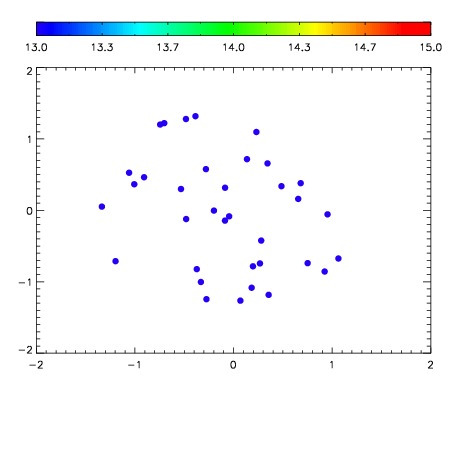

| Frame | Nreads | Zeropoints | Mag plots | Spatial mag deviation | Spatial sky 16325A emission deviations (filled: sky, open: star) | Spatial sky continuum emission | Spatial sky telluric CO2 absorption deviations (filled: H < 10) | |||||||||||||||||||||||
| 0 | 0 |
|
|
|
|
|
|
| IPAIR | NAME | SHIFT | NEWSHIFT | S/N | NAME | SHIFT | NEWSHIFT | S/N |
| 0 | 18050035 | 0.512923 | 0.00000 | 18.3415 | 18050036 | 0.00329924 | 0.509624 | 18.2244 |
| 1 | 18050030 | 0.512059 | 0.000864029 | 18.6573 | 18050029 | 0.00299485 | 0.509928 | 18.5852 |
| 2 | 18050027 | 0.512100 | 0.000823021 | 17.9699 | 18050028 | 0.00331201 | 0.509611 | 18.0215 |
| 3 | 18050031 | 0.512855 | 6.80089e-05 | 17.8917 | 18050032 | 0.00347089 | 0.509452 | 17.8637 |
| 4 | 18050026 | 0.511206 | 0.00171703 | 17.7798 | 18050025 | 0.00000 | 0.512923 | 17.6634 |
| 5 | 18050034 | 0.512628 | 0.000294983 | 17.4151 | 18050033 | 0.00325704 | 0.509666 | 17.2836 |