| Red | Green | Blue | |
| z | 17.64 | ||
| znorm | Inf | ||
| sky | -Inf | -Inf | -Inf |
| S/N | 15.2 | 28.2 | 29.4 |
| S/N(c) | 0.0 | 0.0 | 0.0 |
| SN(E/C) |
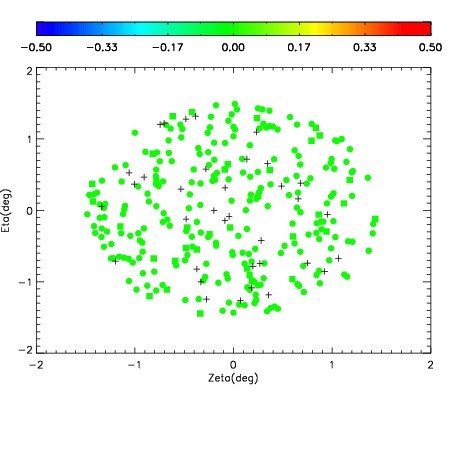
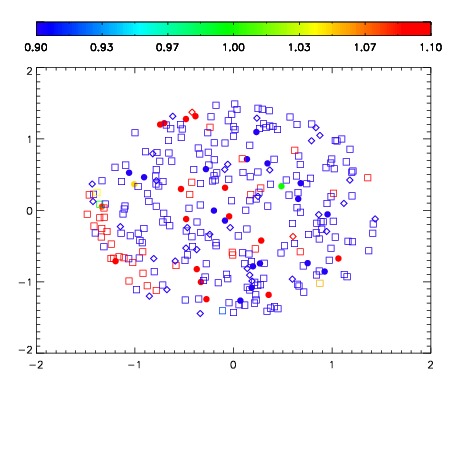
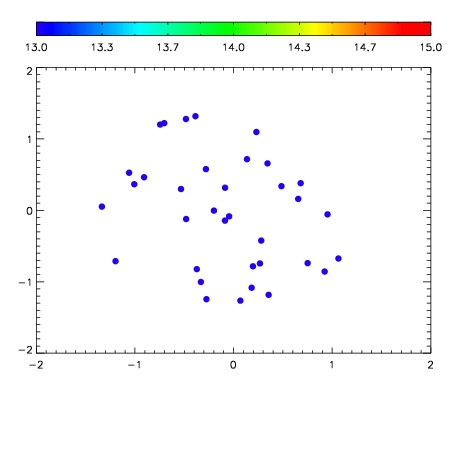

| Frame | Nreads | Zeropoints | Mag plots | Spatial mag deviation | Spatial sky 16325A emission deviations (filled: sky, open: star) | Spatial sky continuum emission | Spatial sky telluric CO2 absorption deviations (filled: H < 10) | |||||||||||||||||||||||
| 0 | 0 |
|
|
|
|
|
|
| IPAIR | NAME | SHIFT | NEWSHIFT | S/N | NAME | SHIFT | NEWSHIFT | S/N |
| 0 | 18060015 | 0.504876 | 0.00000 | 17.8439 | 18060014 | 0.00000 | 0.504876 | 17.9829 |
| 1 | 18060020 | 0.503167 | 0.00170904 | 18.1618 | 18060021 | -0.000171875 | 0.505048 | 18.2368 |
| 2 | 18060019 | 0.503571 | 0.00130504 | 18.1405 | 18060018 | 0.000703414 | 0.504173 | 18.1114 |
| 3 | 18060016 | 0.504345 | 0.000531018 | 18.0855 | 18060017 | 0.000773910 | 0.504102 | 18.0854 |