| Red | Green | Blue | |
| z | 17.64 | ||
| znorm | Inf | ||
| sky | -Inf | -NaN | -Inf |
| S/N | 18.1 | 35.1 | 37.5 |
| S/N(c) | 0.0 | 0.0 | 0.0 |
| SN(E/C) |
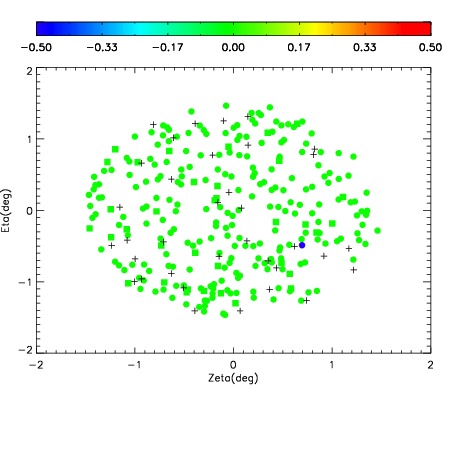
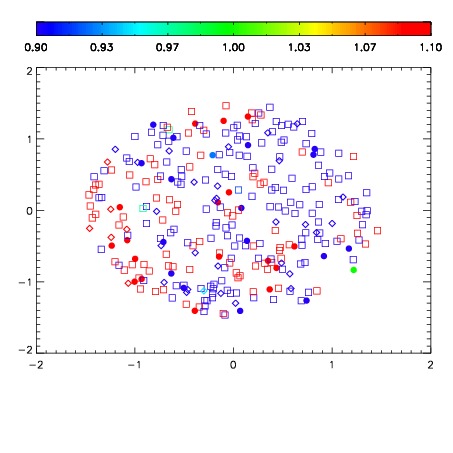
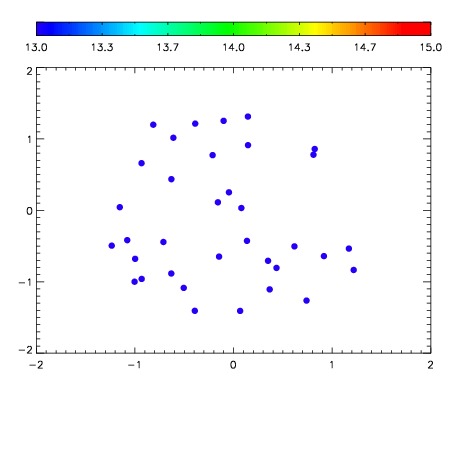

| Frame | Nreads | Zeropoints | Mag plots | Spatial mag deviation | Spatial sky 16325A emission deviations (filled: sky, open: star) | Spatial sky continuum emission | Spatial sky telluric CO2 absorption deviations (filled: H < 10) | |||||||||||||||||||||||
| 0 | 0 |
|
|
|
|
|
|
| IPAIR | NAME | SHIFT | NEWSHIFT | S/N | NAME | SHIFT | NEWSHIFT | S/N |
| 0 | 18030041 | 0.00480472 | 0.00000 | 17.3042 | 18030043 | -0.505507 | 0.510312 | 17.3830 |
| 1 | 18030033 | 0.00000 | 0.00480472 | 18.1674 | 18030035 | -0.506154 | 0.510959 | 18.1462 |
| 2 | 18030036 | 0.00266816 | 0.00213656 | 18.1587 | 18030034 | -0.505779 | 0.510584 | 18.1411 |
| 3 | 18030037 | 0.00334828 | 0.00145644 | 18.0549 | 18030038 | -0.504192 | 0.508997 | 17.8817 |
| 4 | 18030045 | 0.00259270 | 0.00221202 | 17.8668 | 18030046 | -0.503964 | 0.508769 | 17.8055 |
| 5 | 18030044 | 0.00196508 | 0.00283964 | 17.5940 | 18030039 | -0.504168 | 0.508973 | 17.7422 |
| 6 | 18030040 | 0.00404882 | 0.000755900 | 17.2534 | 18030042 | -0.505235 | 0.510040 | 17.1449 |