| Red | Green | Blue | |
| z | 17.64 | ||
| znorm | Inf | ||
| sky | -NaN | -Inf | -Inf |
| S/N | 18.6 | 34.1 | 37.0 |
| S/N(c) | 0.0 | 0.0 | 0.0 |
| SN(E/C) |
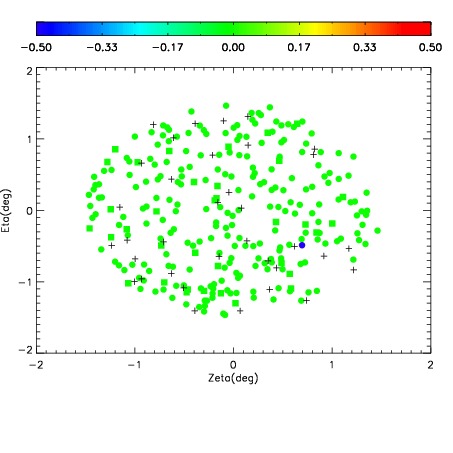
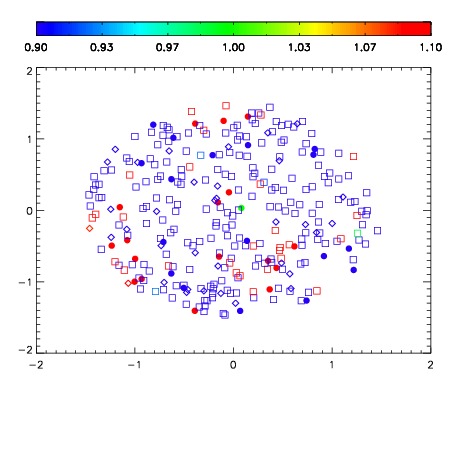
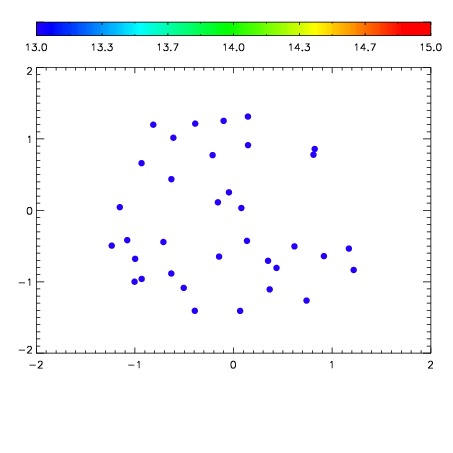

| Frame | Nreads | Zeropoints | Mag plots | Spatial mag deviation | Spatial sky 16325A emission deviations (filled: sky, open: star) | Spatial sky continuum emission | Spatial sky telluric CO2 absorption deviations (filled: H < 10) | |||||||||||||||||||||||
| 0 | 0 |
|
|
|
|
|
|
| IPAIR | NAME | SHIFT | NEWSHIFT | S/N | NAME | SHIFT | NEWSHIFT | S/N |
| 0 | 18040042 | 0.508447 | 0.00000 | 18.1418 | 18040045 | 0.00224399 | 0.506203 | 18.4179 |
| 1 | 18040046 | 0.506678 | 0.00176901 | 18.3485 | 18040043 | 0.00271162 | 0.505735 | 18.4423 |
| 2 | 18040041 | 0.508290 | 0.000156999 | 18.0270 | 18040040 | 0.00000 | 0.508447 | 18.2554 |
| 3 | 18040047 | 0.508433 | 1.40071e-05 | 17.9932 | 18040048 | -0.00217886 | 0.510626 | 17.8692 |