| Red | Green | Blue | |
| z | 17.64 | ||
| znorm | Inf | ||
| sky | -Inf | -Inf | -Inf |
| S/N | 15.3 | 30.2 | 32.5 |
| S/N(c) | 0.0 | 0.0 | 0.0 |
| SN(E/C) |
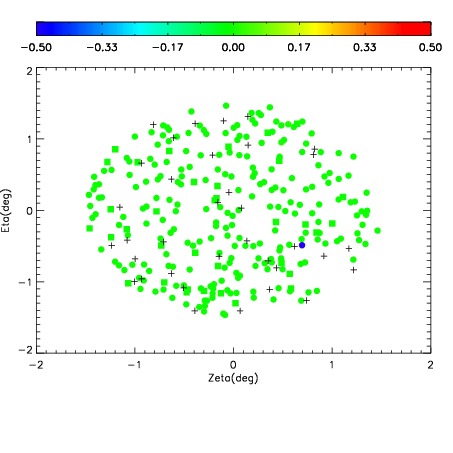
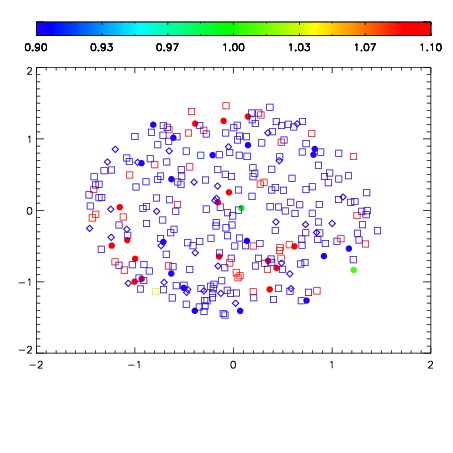
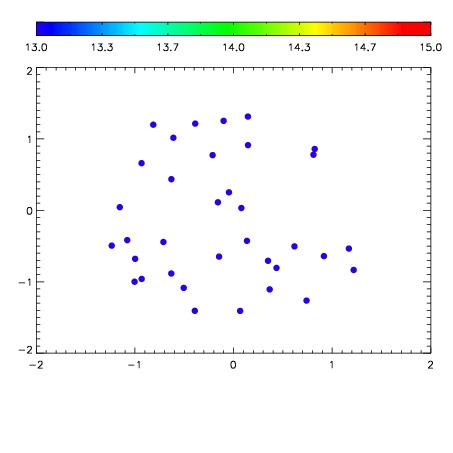

| Frame | Nreads | Zeropoints | Mag plots | Spatial mag deviation | Spatial sky 16325A emission deviations (filled: sky, open: star) | Spatial sky continuum emission | Spatial sky telluric CO2 absorption deviations (filled: H < 10) | |||||||||||||||||||||||
| 0 | 0 |
|
|
|
|
|
|
| IPAIR | NAME | SHIFT | NEWSHIFT | S/N | NAME | SHIFT | NEWSHIFT | S/N |
| 0 | 18050047 | 0.505509 | 0.00000 | 18.0594 | 18050045 | -0.00132423 | 0.506833 | 18.0273 |
| 1 | 18050046 | 0.504407 | 0.00110203 | 18.1426 | 18050048 | 0.000650444 | 0.504859 | 18.1133 |
| 2 | 18050043 | 0.503699 | 0.00181001 | 17.8594 | 18050044 | -0.00123870 | 0.506748 | 17.6927 |
| 3 | 18050042 | 0.503271 | 0.00223804 | 17.3373 | 18050041 | 0.00000 | 0.505509 | 17.5128 |