| Red | Green | Blue | |
| z | 17.64 | ||
| znorm | Inf | ||
| sky | -NaN | -Inf | -NaN |
| S/N | 22.8 | 41.5 | 41.5 |
| S/N(c) | 0.0 | 0.0 | 0.0 |
| SN(E/C) |
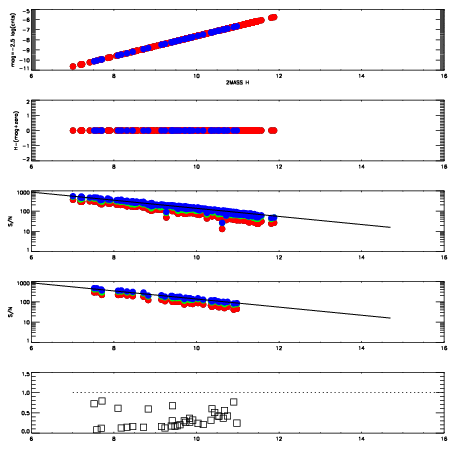

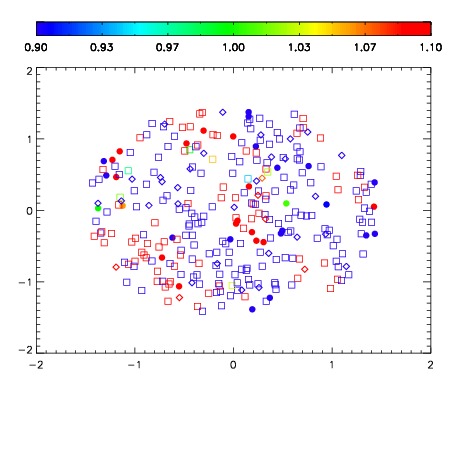
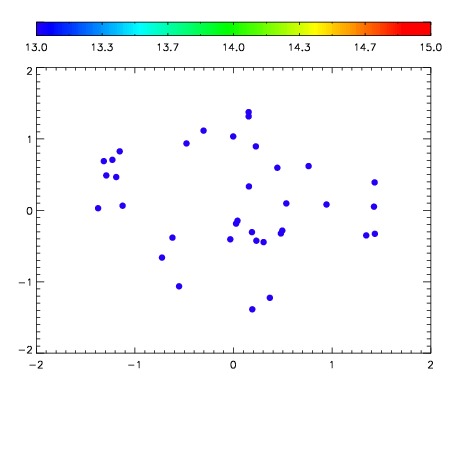

| Frame | Nreads | Zeropoints | Mag plots | Spatial mag deviation | Spatial sky 16325A emission deviations (filled: sky, open: star) | Spatial sky continuum emission | Spatial sky telluric CO2 absorption deviations (filled: H < 10) | |||||||||||||||||||||||
| 0 | 0 |
|
|
|
|
|
|
| IPAIR | NAME | SHIFT | NEWSHIFT | S/N | NAME | SHIFT | NEWSHIFT | S/N |
| 0 | 15310013 | 0.498536 | 0.00000 | 18.0700 | 15310014 | 0.00220118 | 0.496335 | 18.0952 |
| 1 | 15310020 | 0.495969 | 0.00256699 | 18.4179 | 15310018 | 0.00160190 | 0.496934 | 18.4664 |
| 2 | 15310017 | 0.497499 | 0.00103700 | 18.3832 | 15310019 | 0.00155243 | 0.496984 | 18.3787 |
| 3 | 15310016 | 0.497317 | 0.00121900 | 18.2967 | 15310022 | 0.00181198 | 0.496724 | 18.2638 |
| 4 | 15310021 | 0.496465 | 0.00207099 | 18.2635 | 15310015 | 0.00213557 | 0.496400 | 18.2563 |
| 5 | 15310012 | 0.497549 | 0.000986993 | 18.1953 | 15310011 | 0.00000 | 0.498536 | 18.2271 |