| Red | Green | Blue | |
| z | 17.64 | ||
| znorm | Inf | ||
| sky | -Inf | -Inf | -Inf |
| S/N | 23.7 | 41.9 | 41.6 |
| S/N(c) | 0.0 | 0.0 | 0.0 |
| SN(E/C) |
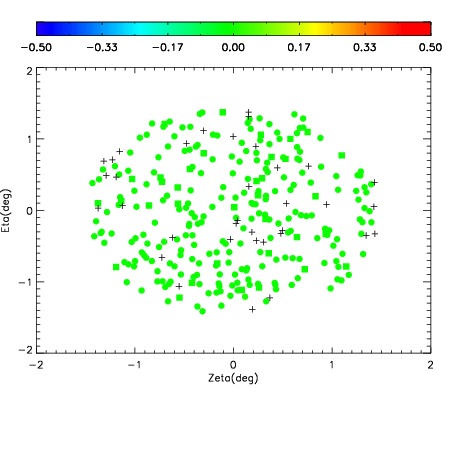
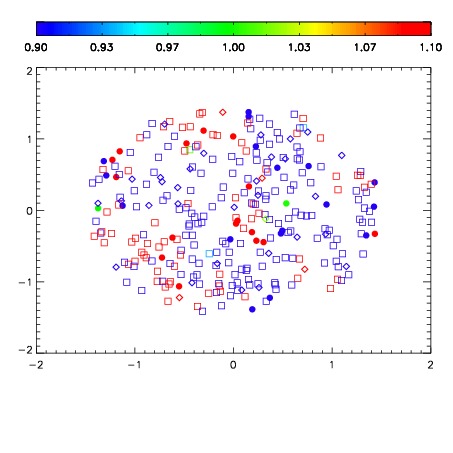
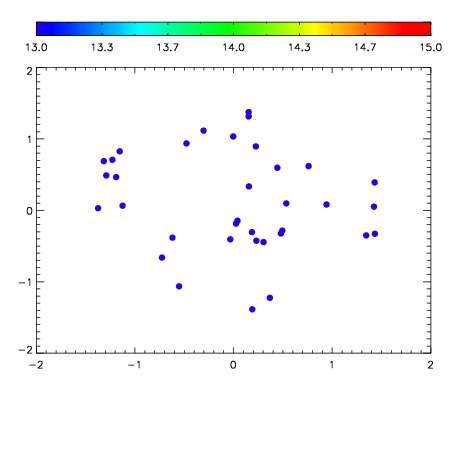

| Frame | Nreads | Zeropoints | Mag plots | Spatial mag deviation | Spatial sky 16325A emission deviations (filled: sky, open: star) | Spatial sky continuum emission | Spatial sky telluric CO2 absorption deviations (filled: H < 10) | |||||||||||||||||||||||
| 0 | 0 |
|
|
|
|
|
|
| IPAIR | NAME | SHIFT | NEWSHIFT | S/N | NAME | SHIFT | NEWSHIFT | S/N |
| 0 | 15340021 | 0.493162 | 0.00000 | 18.1948 | 15340019 | 0.000611746 | 0.492550 | 18.2114 |
| 1 | 15340016 | 0.492644 | 0.000517994 | 18.3972 | 15340015 | 0.00110549 | 0.492057 | 18.4460 |
| 2 | 15340017 | 0.492420 | 0.000742018 | 18.3423 | 15340018 | 0.000393505 | 0.492768 | 18.2992 |
| 3 | 15340020 | 0.492847 | 0.000315011 | 18.2264 | 15340011 | 0.00000 | 0.493162 | 18.2686 |
| 4 | 15340012 | 0.491577 | 0.00158501 | 18.1993 | 15340014 | 0.00123315 | 0.491929 | 18.2160 |
| 5 | 15340013 | 0.492530 | 0.000632018 | 18.1812 | 15340022 | 0.00143237 | 0.491730 | 18.1414 |