| Red | Green | Blue | |
| z | 17.64 | ||
| znorm | Inf | ||
| sky | -Inf | -Inf | -NaN |
| S/N | 22.7 | 43.3 | 45.9 |
| S/N(c) | 0.0 | 0.0 | 0.0 |
| SN(E/C) |
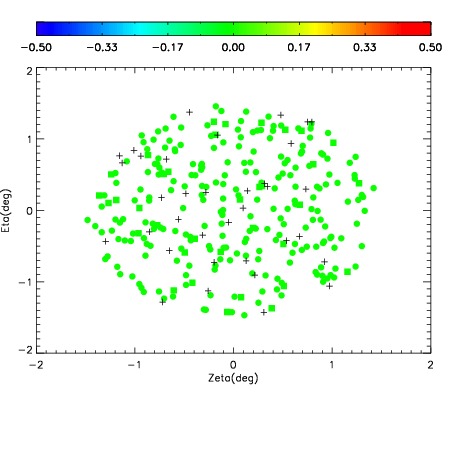
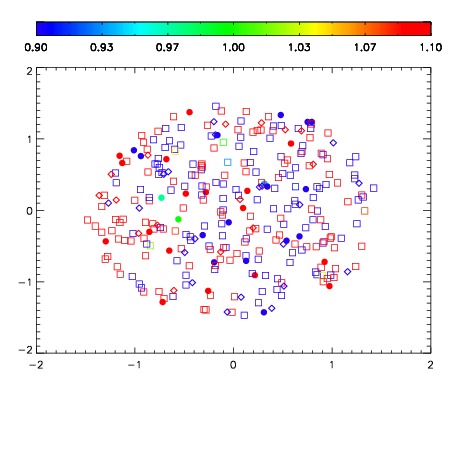


| Frame | Nreads | Zeropoints | Mag plots | Spatial mag deviation | Spatial sky 16325A emission deviations (filled: sky, open: star) | Spatial sky continuum emission | Spatial sky telluric CO2 absorption deviations (filled: H < 10) | |||||||||||||||||||||||
| 0 | 0 |
|
|
|
|
|
|
| IPAIR | NAME | SHIFT | NEWSHIFT | S/N | NAME | SHIFT | NEWSHIFT | S/N |
| 0 | 18000040 | 0.00211341 | 0.00000 | 18.1164 | 18000041 | -0.502319 | 0.504432 | 18.0703 |
| 1 | 18000036 | 0.00139351 | 0.000719900 | 18.6863 | 18000045 | -0.500696 | 0.502809 | 18.4403 |
| 2 | 18000044 | 0.00184032 | 0.000273090 | 18.4451 | 18000038 | -0.502161 | 0.504274 | 18.3289 |
| 3 | 18000047 | 0.00140077 | 0.000712640 | 18.3817 | 18000046 | -0.501048 | 0.503161 | 18.2775 |
| 4 | 18000032 | 0.00000 | 0.00211341 | 18.3619 | 18000037 | -0.502265 | 0.504378 | 18.1814 |
| 5 | 18000039 | 0.00175361 | 0.000359800 | 18.3281 | 18000042 | -0.502602 | 0.504715 | 18.1803 |
| 6 | 18000043 | 0.00190545 | 0.000207960 | 18.1466 | 18000033 | -0.500120 | 0.502233 | 18.1075 |
| 7 | 18000035 | 0.00157999 | 0.000533420 | 18.0361 | 18000034 | -0.501135 | 0.503248 | 17.9409 |