| Red | Green | Blue | |
| z | 17.64 | ||
| znorm | Inf | ||
| sky | -Inf | -Inf | -Inf |
| S/N | 21.6 | 37.2 | 45.0 |
| S/N(c) | 0.0 | 0.0 | 0.0 |
| SN(E/C) |
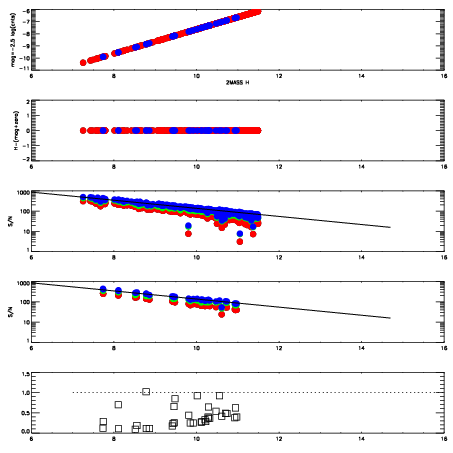


| Frame | Nreads | Zeropoints | Mag plots | Spatial mag deviation | Spatial sky 16325A emission deviations (filled: sky, open: star) | Spatial sky continuum emission | Spatial sky telluric CO2 absorption deviations (filled: H < 10) | |||||||||||||||||||||||
| 0 | 0 |
|
|
|
|
|
|
| IPAIR | NAME | SHIFT | NEWSHIFT | S/N | NAME | SHIFT | NEWSHIFT | S/N |
| 0 | 18380037 | 0.506570 | 0.00000 | 17.6251 | 18380038 | 0.00463665 | 0.501933 | 17.6381 |
| 1 | 18380028 | 0.502144 | 0.00442600 | 18.4274 | 18380027 | 0.00000 | 0.506570 | 18.4596 |
| 2 | 18380029 | 0.502865 | 0.00370497 | 18.4241 | 18380035 | 0.00281193 | 0.503758 | 18.3963 |
| 3 | 18380036 | 0.504765 | 0.00180501 | 18.3590 | 18380030 | 0.00390600 | 0.502664 | 18.3548 |
| 4 | 18380033 | 0.503462 | 0.00310796 | 18.2196 | 18380034 | 0.00306125 | 0.503509 | 18.3195 |
| 5 | 18380032 | 0.503839 | 0.00273097 | 17.8723 | 18380031 | 0.00387583 | 0.502694 | 17.9108 |