| Red | Green | Blue | |
| z | 17.64 | ||
| znorm | Inf | ||
| sky | -Inf | -Inf | -Inf |
| S/N | 26.3 | 48.0 | 51.1 |
| S/N(c) | 0.0 | 0.0 | 0.0 |
| SN(E/C) |
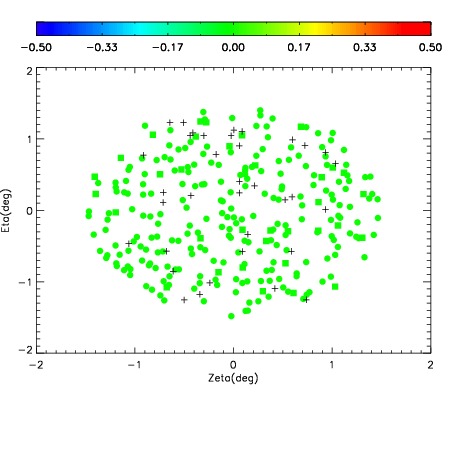
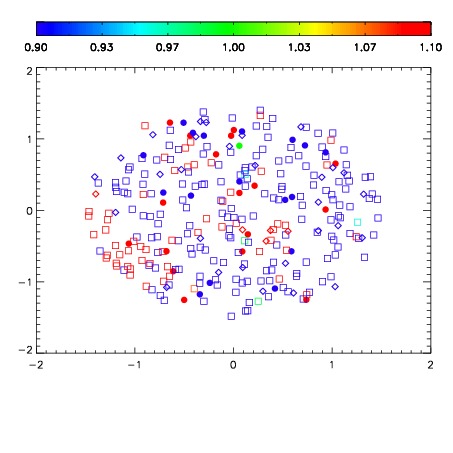
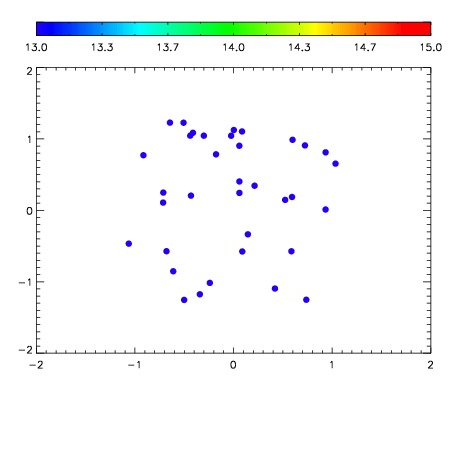

| Frame | Nreads | Zeropoints | Mag plots | Spatial mag deviation | Spatial sky 16325A emission deviations (filled: sky, open: star) | Spatial sky continuum emission | Spatial sky telluric CO2 absorption deviations (filled: H < 10) | |||||||||||||||||||||||
| 0 | 0 |
|
|
|
|
|
|
| IPAIR | NAME | SHIFT | NEWSHIFT | S/N | NAME | SHIFT | NEWSHIFT | S/N |
| 0 | 15900021 | 0.490534 | 0.00000 | 18.3528 | 15900022 | 0.00254135 | 0.487993 | 18.3183 |
| 1 | 15900012 | 0.488253 | 0.00228101 | 18.8215 | 15900011 | 0.00000 | 0.490534 | 18.8127 |
| 2 | 15900017 | 0.489890 | 0.000643998 | 18.6191 | 15900018 | 0.00286400 | 0.487670 | 18.6329 |
| 3 | 15900024 | 0.490034 | 0.000499994 | 18.4599 | 15900023 | 0.00229917 | 0.488235 | 18.4930 |
| 4 | 15900020 | 0.490246 | 0.000288010 | 18.2709 | 15900019 | 0.00335723 | 0.487177 | 18.1887 |
| 5 | 15900016 | 0.490246 | 0.000288010 | 18.1796 | 15900015 | 0.00235549 | 0.488179 | 18.1340 |
| 6 | 15900013 | 0.489427 | 0.00110701 | 17.8788 | 15900014 | 0.00186249 | 0.488672 | 17.9732 |