| Red | Green | Blue | |
| z | 17.64 | ||
| znorm | Inf | ||
| sky | -Inf | -Inf | -NaN |
| S/N | 24.8 | 43.9 | 47.6 |
| S/N(c) | 0.0 | 0.0 | 0.0 |
| SN(E/C) |
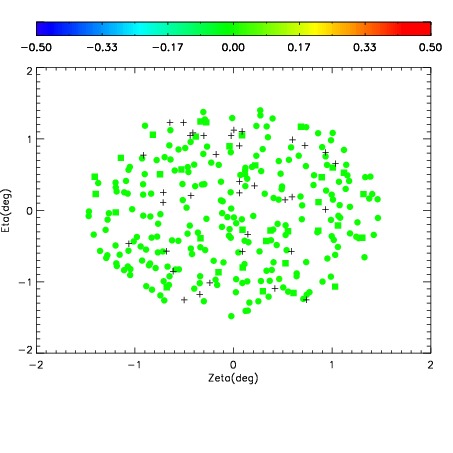
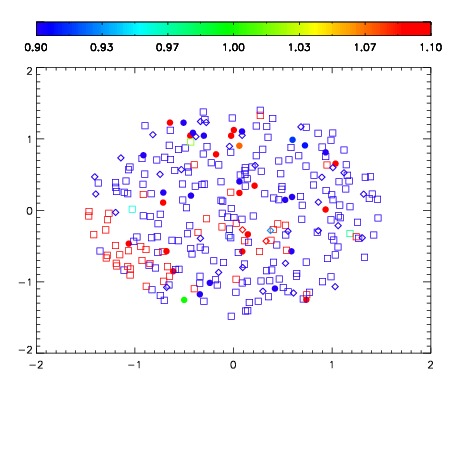


| Frame | Nreads | Zeropoints | Mag plots | Spatial mag deviation | Spatial sky 16325A emission deviations (filled: sky, open: star) | Spatial sky continuum emission | Spatial sky telluric CO2 absorption deviations (filled: H < 10) | |||||||||||||||||||||||
| 0 | 0 |
|
|
|
|
|
|
| IPAIR | NAME | SHIFT | NEWSHIFT | S/N | NAME | SHIFT | NEWSHIFT | S/N |
| 0 | 15910019 | 0.493693 | 0.00000 | 18.1505 | 15910020 | 0.00378987 | 0.489903 | 18.1633 |
| 1 | 15910015 | 0.490528 | 0.00316501 | 18.7794 | 15910016 | 0.00145502 | 0.492238 | 18.8017 |
| 2 | 15910014 | 0.489479 | 0.00421399 | 18.7611 | 15910021 | 0.00354377 | 0.490149 | 18.7710 |
| 3 | 15910022 | 0.493053 | 0.000640005 | 18.7376 | 15910013 | 0.00000 | 0.493693 | 18.7704 |
| 4 | 15910018 | 0.492893 | 0.000799984 | 17.9998 | 15910017 | 0.00283395 | 0.490859 | 18.0439 |