| Red | Green | Blue | |
| z | 17.64 | ||
| znorm | Inf | ||
| sky | -Inf | -Inf | -NaN |
| S/N | 30.9 | 54.3 | 60.0 |
| S/N(c) | 0.0 | 0.0 | 0.0 |
| SN(E/C) |
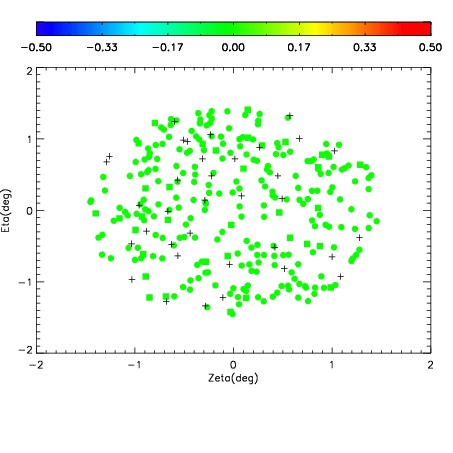
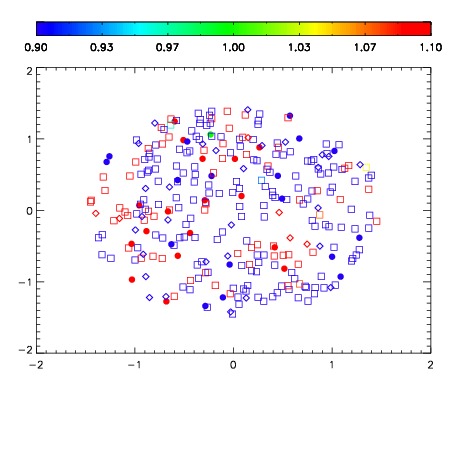


| Frame | Nreads | Zeropoints | Mag plots | Spatial mag deviation | Spatial sky 16325A emission deviations (filled: sky, open: star) | Spatial sky continuum emission | Spatial sky telluric CO2 absorption deviations (filled: H < 10) | |||||||||||||||||||||||
| 0 | 0 |
|
|
|
|
|
|
| IPAIR | NAME | SHIFT | NEWSHIFT | S/N | NAME | SHIFT | NEWSHIFT | S/N |
| 0 | 15650060 | 0.488862 | 0.00000 | 18.1463 | 15650061 | 0.00138976 | 0.487472 | 18.0866 |
| 1 | 15650059 | 0.488373 | 0.000488997 | 18.5223 | 15650058 | 0.000272048 | 0.488590 | 18.5126 |
| 2 | 15650064 | 0.487776 | 0.00108600 | 18.5108 | 15650065 | -0.000745831 | 0.489608 | 18.5071 |
| 3 | 15650056 | 0.488413 | 0.000449002 | 18.5052 | 15650057 | 6.11118e-05 | 0.488801 | 18.5016 |
| 4 | 15650063 | 0.488196 | 0.000666022 | 18.4675 | 15650062 | 0.000310557 | 0.488551 | 18.4911 |
| 5 | 15650055 | 0.488475 | 0.000387013 | 18.4522 | 15650053 | 0.00155868 | 0.487303 | 18.4184 |
| 6 | 15650052 | 0.488173 | 0.000689000 | 18.3946 | 15650054 | 0.00142754 | 0.487434 | 18.4026 |
| 7 | 15650051 | 0.488243 | 0.000618994 | 18.2210 | 15650050 | 0.00000 | 0.488862 | 18.3547 |
| 8 | 15650067 | 0.486617 | 0.00224501 | 17.7987 | 15650066 | -0.000428855 | 0.489291 | 17.8552 |