| Red | Green | Blue | |
| z | 17.64 | ||
| znorm | Inf | ||
| sky | -Inf | -Inf | -NaN |
| S/N | 28.1 | 51.2 | 51.0 |
| S/N(c) | 0.0 | 0.0 | 0.0 |
| SN(E/C) |
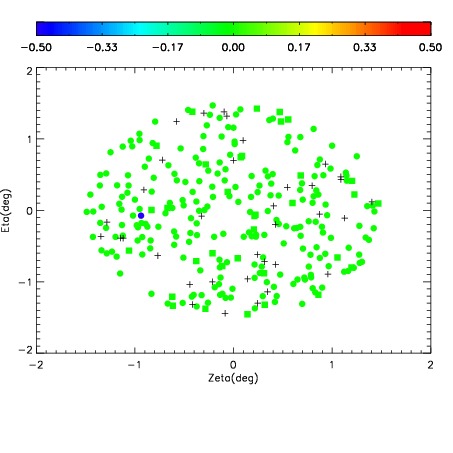
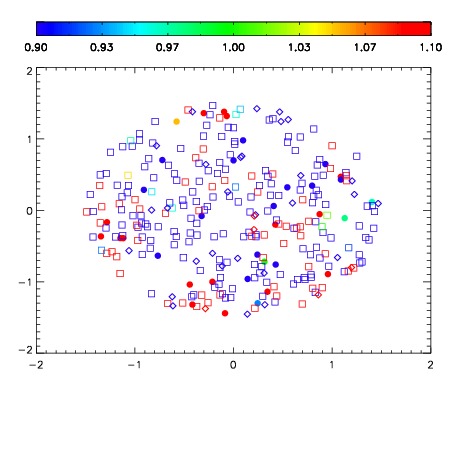
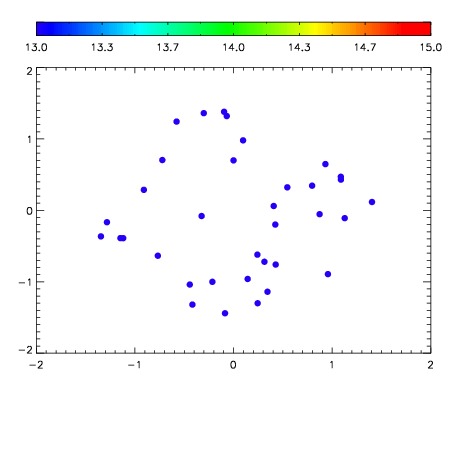

| Frame | Nreads | Zeropoints | Mag plots | Spatial mag deviation | Spatial sky 16325A emission deviations (filled: sky, open: star) | Spatial sky continuum emission | Spatial sky telluric CO2 absorption deviations (filled: H < 10) | |||||||||||||||||||||||
| 0 | 0 |
|
|
|
|
|
|
| IPAIR | NAME | SHIFT | NEWSHIFT | S/N | NAME | SHIFT | NEWSHIFT | S/N |
| 0 | 15890029 | 0.491427 | 0.00000 | 17.8627 | 15890030 | 0.00299983 | 0.488427 | 17.8262 |
| 1 | 15890012 | 0.487633 | 0.00379401 | 18.7740 | 15890011 | 0.00000 | 0.491427 | 18.8745 |
| 2 | 15890025 | 0.490417 | 0.00101000 | 18.5478 | 15890026 | 0.00237452 | 0.489052 | 18.5530 |
| 3 | 15890020 | 0.490104 | 0.00132301 | 18.4952 | 15890027 | 0.00149038 | 0.489937 | 18.4483 |
| 4 | 15890028 | 0.489961 | 0.00146601 | 18.4625 | 15890019 | 0.00135478 | 0.490072 | 18.4143 |
| 5 | 15890021 | 0.490472 | 0.000955015 | 18.4082 | 15890022 | 0.00189326 | 0.489534 | 18.3601 |
| 6 | 15890016 | 0.489638 | 0.00178900 | 18.3432 | 15890014 | 0.00183334 | 0.489594 | 18.3532 |
| 7 | 15890013 | 0.489111 | 0.00231600 | 18.3225 | 15890015 | 0.00101817 | 0.490409 | 18.3341 |
| 8 | 15890017 | 0.489646 | 0.00178102 | 18.2878 | 15890018 | 0.00189037 | 0.489537 | 18.3064 |
| 9 | 15890024 | 0.489327 | 0.00209999 | 18.1069 | 15890023 | 0.00174696 | 0.489680 | 18.1546 |