| Red | Green | Blue | |
| z | 17.65 | ||
| znorm | Inf | ||
| sky | -Inf | -Inf | -Inf |
| S/N | 19.2 | 34.9 | 37.2 |
| S/N(c) | 46.0 | 24.7 | 24.1 |
| SN(E/C) |
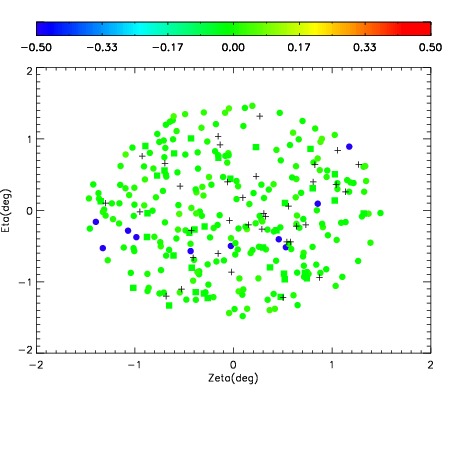
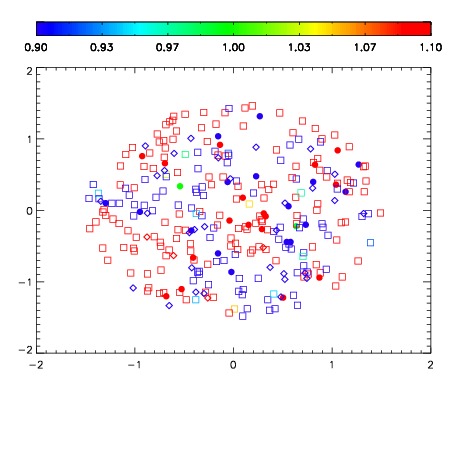
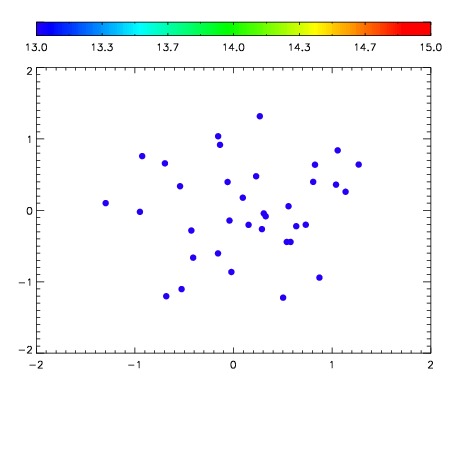

| Frame | Nreads | Zeropoints | Mag plots | Spatial mag deviation | Spatial sky 16325A emission deviations (filled: sky, open: star) | Spatial sky continuum emission | Spatial sky telluric CO2 absorption deviations (filled: H < 10) | |||||||||||||||||||||||
| 0 | 0 |
|
|
|
|
|
|
| IPAIR | NAME | SHIFT | NEWSHIFT | S/N | NAME | SHIFT | NEWSHIFT | S/N |
| 0 | 15260054 | 0.507214 | 0.00000 | 18.9214 | 15260052 | -0.00166254 | 0.508877 | 18.9672 |
| 1 | 15260053 | 0.506146 | 0.00106800 | 18.7128 | 15260051 | -0.00132206 | 0.508536 | 18.9626 |
| 2 | 15260049 | 0.505638 | 0.00157601 | 18.7047 | 15260055 | -0.000453138 | 0.507667 | 18.9452 |
| 3 | 15260050 | 0.506416 | 0.000797987 | 18.6089 | 15260048 | 0.00000 | 0.507214 | 18.3043 |