| Red | Green | Blue | |
| z | 17.64 | ||
| znorm | Inf | ||
| sky | -Inf | -Inf | -NaN |
| S/N | 21.4 | 40.9 | 42.1 |
| S/N(c) | 18.1 | 78.7 | 58.2 |
| SN(E/C) |
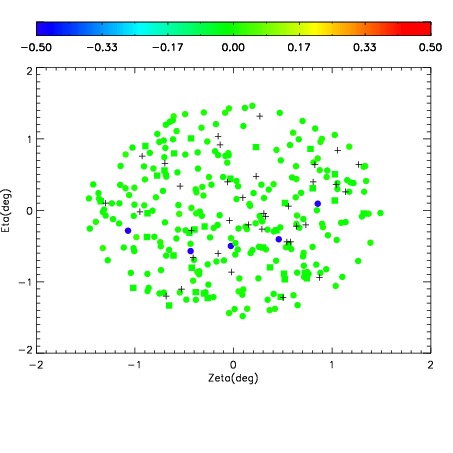
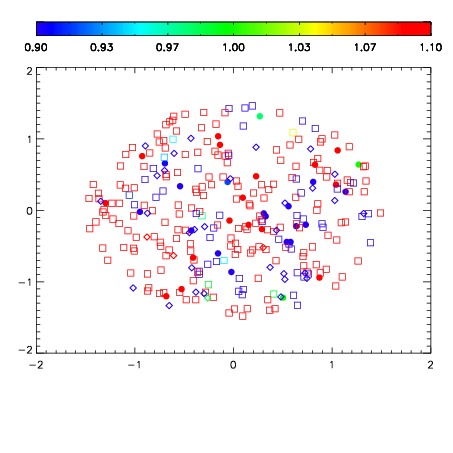
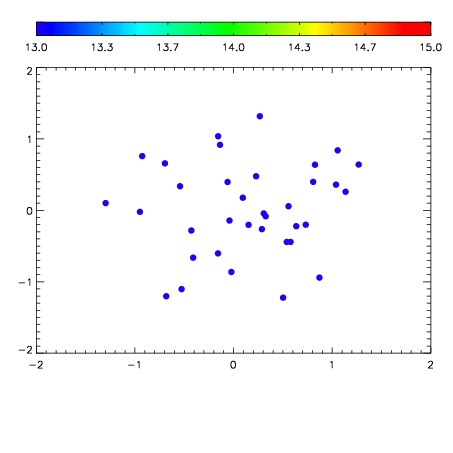

| Frame | Nreads | Zeropoints | Mag plots | Spatial mag deviation | Spatial sky 16325A emission deviations (filled: sky, open: star) | Spatial sky continuum emission | Spatial sky telluric CO2 absorption deviations (filled: H < 10) | |||||||||||||||||||||||
| 0 | 0 |
|
|
|
|
|
|
| IPAIR | NAME | SHIFT | NEWSHIFT | S/N | NAME | SHIFT | NEWSHIFT | S/N |
| 0 | 15300054 | 0.00110849 | 0.00000 | 19.0328 | 15300055 | -0.493942 | 0.495050 | 18.9831 |
| 1 | 15300050 | 0.00000 | 0.00110849 | 19.0010 | 15300051 | -0.496696 | 0.497804 | 18.9826 |
| 2 | 15300053 | 0.000427066 | 0.000681424 | 19.0001 | 15300052 | -0.496415 | 0.497523 | 18.9819 |
| 3 | 15300057 | 0.000536949 | 0.000571541 | 18.9955 | 15300056 | -0.493947 | 0.495055 | 18.9580 |