| Red | Green | Blue | |
| z | 17.64 | ||
| znorm | Inf | ||
| sky | -Inf | -Inf | -Inf |
| S/N | 24.4 | 43.9 | 47.8 |
| S/N(c) | 55.7 | 29.7 | 27.9 |
| SN(E/C) |
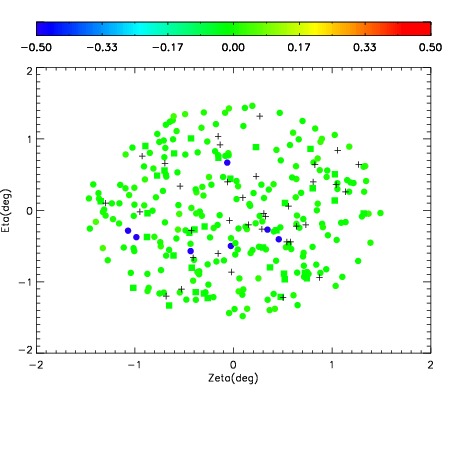
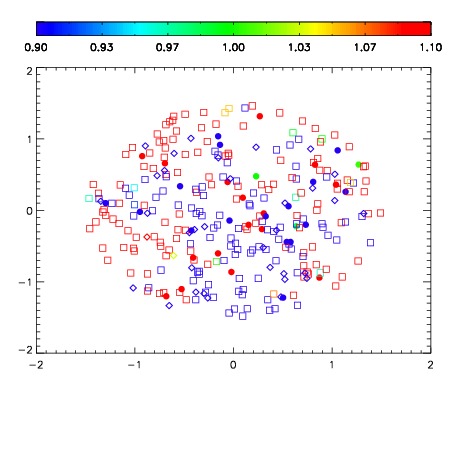
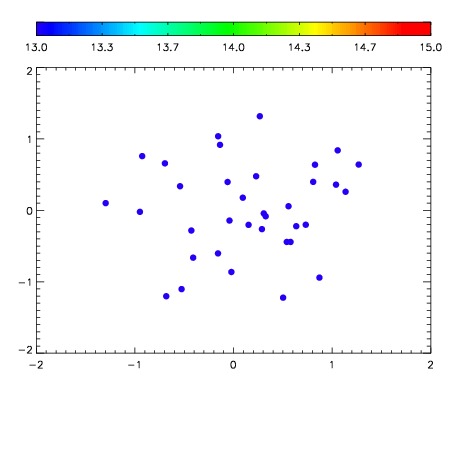

| Frame | Nreads | Zeropoints | Mag plots | Spatial mag deviation | Spatial sky 16325A emission deviations (filled: sky, open: star) | Spatial sky continuum emission | Spatial sky telluric CO2 absorption deviations (filled: H < 10) | |||||||||||||||||||||||
| 0 | 0 |
|
|
|
|
|
|
| IPAIR | NAME | SHIFT | NEWSHIFT | S/N | NAME | SHIFT | NEWSHIFT | S/N |
| 0 | 15470039 | 0.497492 | 0.00000 | 19.1411 | 15470042 | 0.000324513 | 0.497167 | 19.1282 |
| 1 | 15470044 | 0.495563 | 0.00192899 | 19.1504 | 15470045 | 0.000371080 | 0.497121 | 19.1356 |
| 2 | 15470043 | 0.495171 | 0.00232098 | 19.1367 | 15470041 | 0.000293047 | 0.497199 | 19.0996 |
| 3 | 15470040 | 0.497448 | 4.39882e-05 | 19.0868 | 15470038 | 0.00000 | 0.497492 | 19.0875 |