| Red | Green | Blue | |
| z | 17.65 | ||
| znorm | Inf | ||
| sky | -Inf | -Inf | -Inf |
| S/N | 19.5 | 34.3 | 35.7 |
| S/N(c) | 42.1 | 29.4 | 46.0 |
| SN(E/C) |
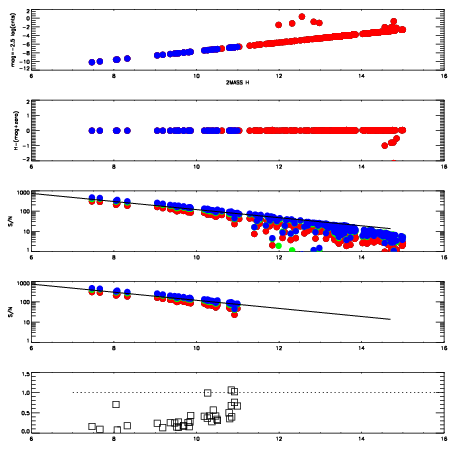
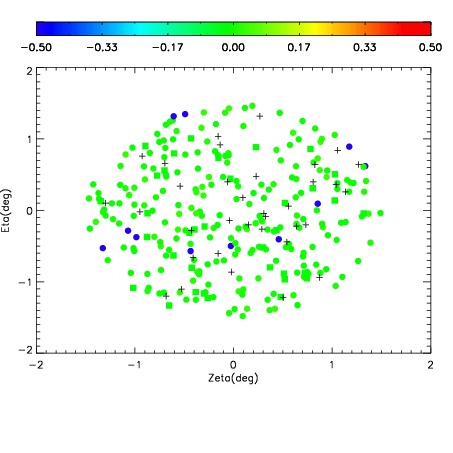
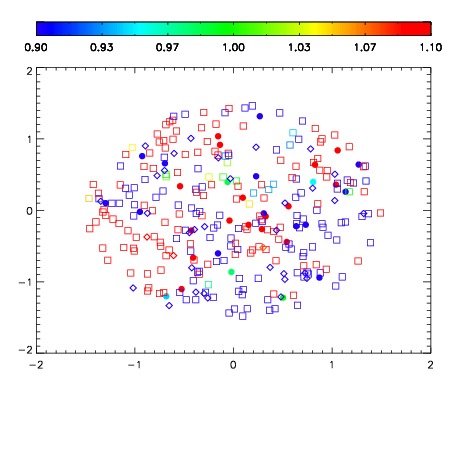
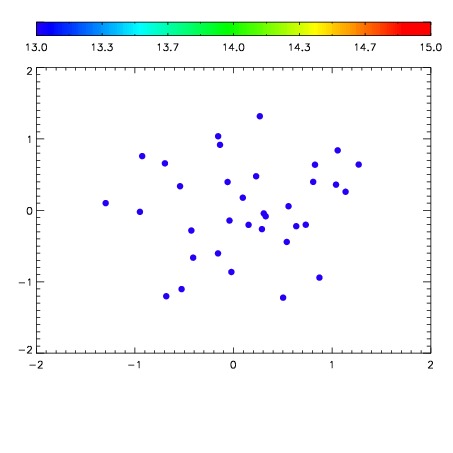

| Frame | Nreads | Zeropoints | Mag plots | Spatial mag deviation | Spatial sky 16325A emission deviations (filled: sky, open: star) | Spatial sky continuum emission | Spatial sky telluric CO2 absorption deviations (filled: H < 10) | |||||||||||||||||||||||
| 0 | 0 |
|
|
|
|
|
|
| IPAIR | NAME | SHIFT | NEWSHIFT | S/N | NAME | SHIFT | NEWSHIFT | S/N |
| 0 | 15550035 | 0.00228127 | 0.00000 | 18.5221 | 15550032 | -0.490758 | 0.493039 | 17.9511 |
| 1 | 15550038 | 0.000618443 | 0.00166283 | 19.1089 | 15550037 | -0.492021 | 0.494302 | 19.0344 |
| 2 | 15550031 | 0.00000 | 0.00228127 | 19.0549 | 15550036 | -0.491908 | 0.494189 | 18.8743 |
| 3 | 15550034 | 0.00136454 | 0.000916730 | 18.9374 | 15550033 | -0.491216 | 0.493497 | 18.1722 |