| Red | Green | Blue | |
| z | 17.65 | ||
| znorm | Inf | ||
| sky | -Inf | -Inf | -Inf |
| S/N | 14.6 | 28.8 | 29.4 |
| S/N(c) | 13.3 | 59.0 | 44.4 |
| SN(E/C) |
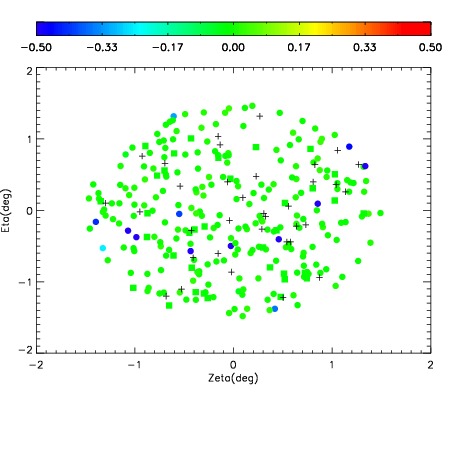
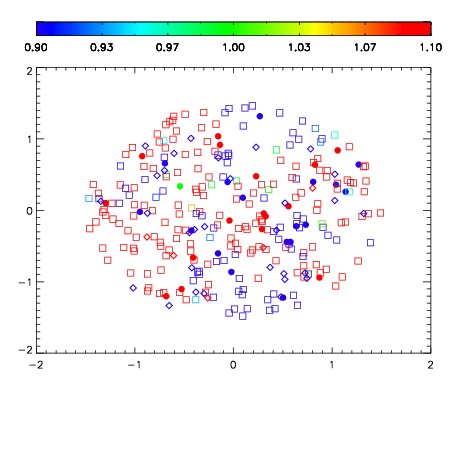
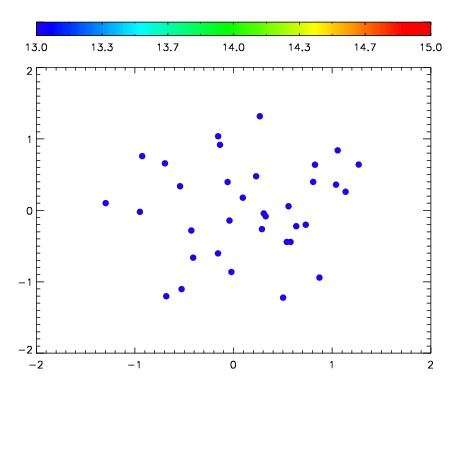

| Frame | Nreads | Zeropoints | Mag plots | Spatial mag deviation | Spatial sky 16325A emission deviations (filled: sky, open: star) | Spatial sky continuum emission | Spatial sky telluric CO2 absorption deviations (filled: H < 10) | |||||||||||||||||||||||
| 0 | 0 |
|
|
|
|
|
|
| IPAIR | NAME | SHIFT | NEWSHIFT | S/N | NAME | SHIFT | NEWSHIFT | S/N |
| 0 | 15580031 | 0.495342 | 0.00000 | 18.7153 | 15580036 | 0.00327288 | 0.492069 | 18.5950 |
| 1 | 15580030 | 0.495035 | 0.000306994 | 18.6195 | 15580032 | 0.00246027 | 0.492882 | 18.5322 |
| 2 | 15580035 | 0.494372 | 0.000969976 | 18.4882 | 15580033 | 0.00219372 | 0.493148 | 18.4926 |
| 3 | 15580034 | 0.493857 | 0.00148499 | 18.2975 | 15580029 | 0.00000 | 0.495342 | 18.2009 |