| Red | Green | Blue | |
| z | 17.64 | ||
| znorm | Inf | ||
| sky | -Inf | -Inf | -NaN |
| S/N | 5.8 | 10.2 | 12.3 |
| S/N(c) | 6.5 | 5.5 | 14.7 |
| SN(E/C) |
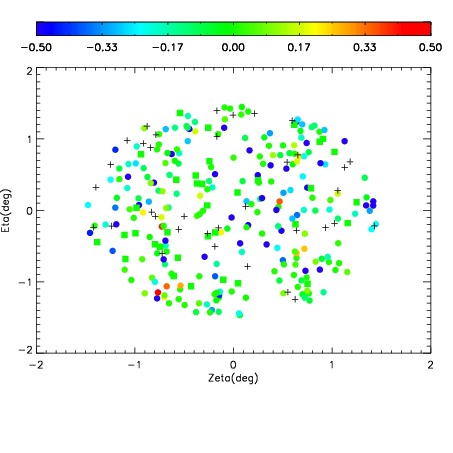
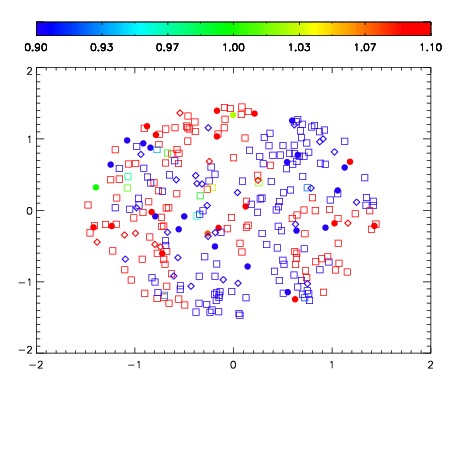
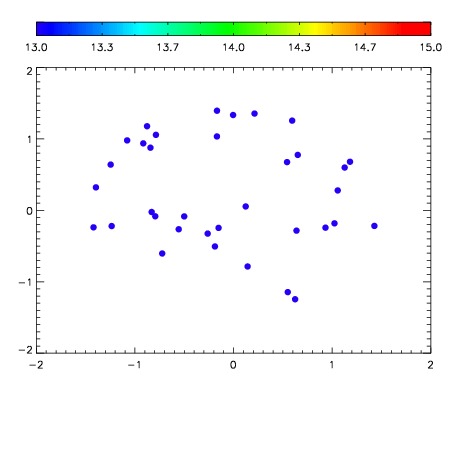

| Frame | Nreads | Zeropoints | Mag plots | Spatial mag deviation | Spatial sky 16325A emission deviations (filled: sky, open: star) | Spatial sky continuum emission | Spatial sky telluric CO2 absorption deviations (filled: H < 10) | |||||||||||||||||||||||
| 0 | 0 |
|
|
|
|
|
|
| IPAIR | NAME | SHIFT | NEWSHIFT | S/N | NAME | SHIFT | NEWSHIFT | S/N |
| 0 | 15530057 | 0.00221575 | 0.00000 | 17.0553 | 15530059 | -0.493743 | 0.495959 | 16.8431 |
| 1 | 15530061 | 0.000888863 | 0.00132689 | 16.8174 | 15530056 | -0.492601 | 0.494817 | 16.6052 |
| 2 | 15530058 | 0.00187153 | 0.000344220 | 16.2815 | 15530060 | -0.493659 | 0.495875 | 16.4703 |
| 3 | 15530054 | 0.00000 | 0.00221575 | 15.2773 | 15530055 | -0.493406 | 0.495622 | 16.3574 |