| Red | Green | Blue | |
| z | 17.64 | ||
| znorm | Inf | ||
| sky | -Inf | -Inf | -Inf |
| S/N | 25.1 | 39.4 | 45.1 |
| S/N(c) | 26.3 | 18.1 | 47.7 |
| SN(E/C) |
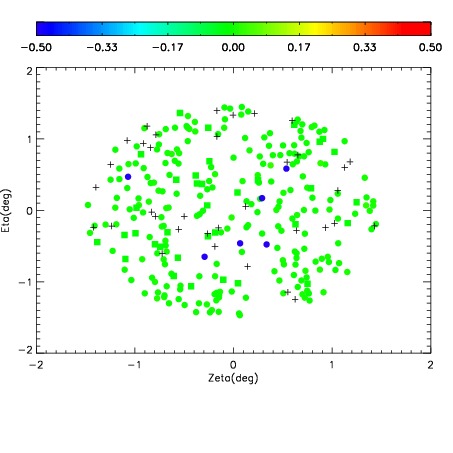
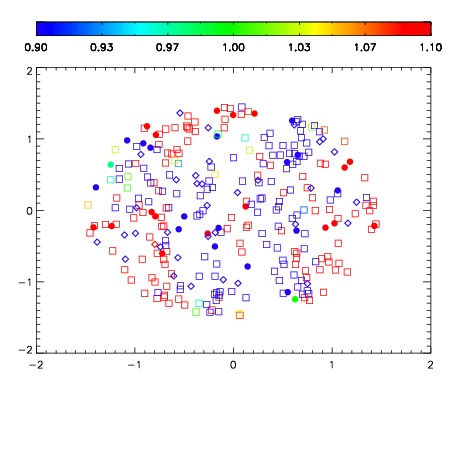
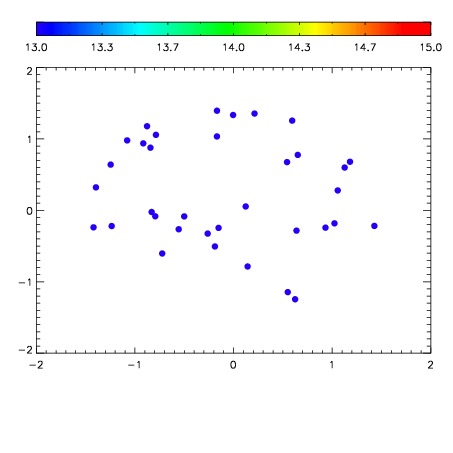

| Frame | Nreads | Zeropoints | Mag plots | Spatial mag deviation | Spatial sky 16325A emission deviations (filled: sky, open: star) | Spatial sky continuum emission | Spatial sky telluric CO2 absorption deviations (filled: H < 10) | |||||||||||||||||||||||
| 0 | 0 |
|
|
|
|
|
|
| IPAIR | NAME | SHIFT | NEWSHIFT | S/N | NAME | SHIFT | NEWSHIFT | S/N |
| 0 | 15540017 | 0.495973 | 0.00000 | 17.9699 | 15540015 | 0.00169526 | 0.494278 | 18.0584 |
| 1 | 15540012 | 0.495245 | 0.000727981 | 18.7506 | 15540011 | 0.00000 | 0.495973 | 18.8042 |
| 2 | 15540013 | 0.494820 | 0.00115299 | 18.6646 | 15540014 | 0.00129900 | 0.494674 | 18.6822 |
| 3 | 15540016 | 0.495712 | 0.000260979 | 18.1051 | 15540018 | 0.00115646 | 0.494817 | 18.0829 |