| Red | Green | Blue | |
| z | 17.64 | ||
| znorm | Inf | ||
| sky | -Inf | -NaN | -NaN |
| S/N | 25.5 | 38.9 | 46.8 |
| S/N(c) | 25.9 | 37.3 | 42.1 |
| SN(E/C) |
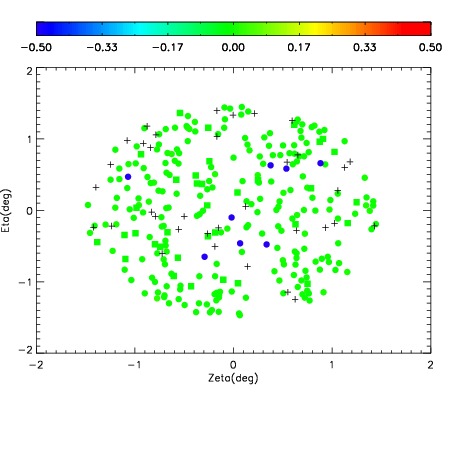
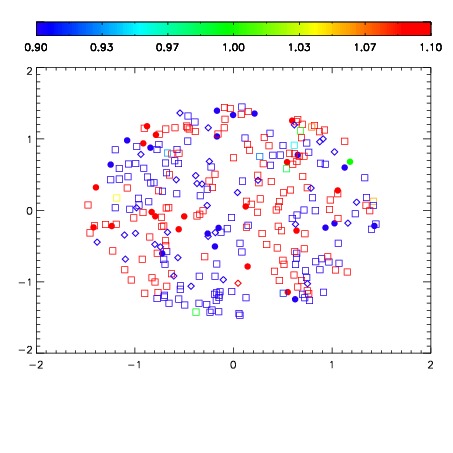


| Frame | Nreads | Zeropoints | Mag plots | Spatial mag deviation | Spatial sky 16325A emission deviations (filled: sky, open: star) | Spatial sky continuum emission | Spatial sky telluric CO2 absorption deviations (filled: H < 10) | |||||||||||||||||||||||
| 0 | 0 |
|
|
|
|
|
|
| IPAIR | NAME | SHIFT | NEWSHIFT | S/N | NAME | SHIFT | NEWSHIFT | S/N |
| 0 | 15570060 | 0.492517 | 0.00000 | 18.8888 | 15570059 | 0.00000 | 0.492517 | 18.9574 |
| 1 | 15570061 | 0.492351 | 0.000165999 | 18.7687 | 15570066 | -0.000412664 | 0.492930 | 18.7952 |
| 2 | 15570065 | 0.489775 | 0.00274199 | 18.7000 | 15570062 | -0.000252408 | 0.492769 | 17.6755 |
| 3 | 15570064 | 0.489900 | 0.00261700 | 18.4571 | 15570063 | -0.000920886 | 0.493438 | 17.1439 |