| Red | Green | Blue | |
| z | 17.64 | ||
| znorm | Inf | ||
| sky | -Inf | -Inf | -Inf |
| S/N | 32.7 | 47.2 | 59.9 |
| S/N(c) | 32.2 | 48.7 | 79.3 |
| SN(E/C) |
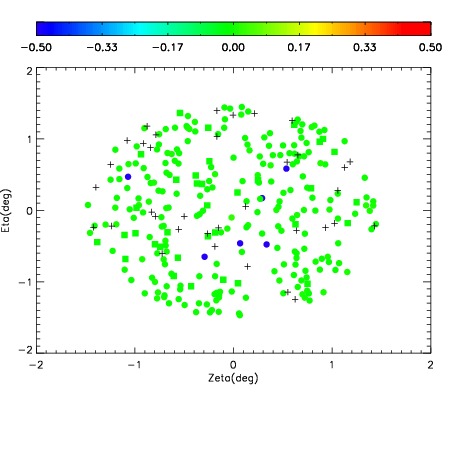
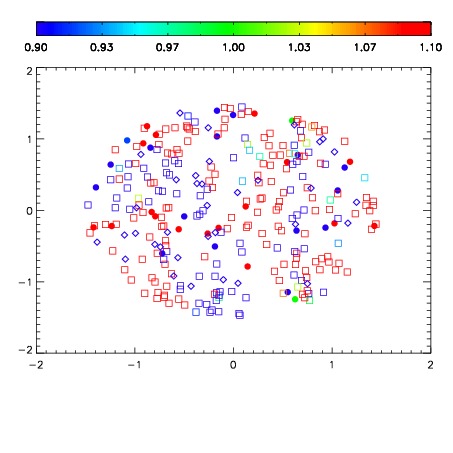
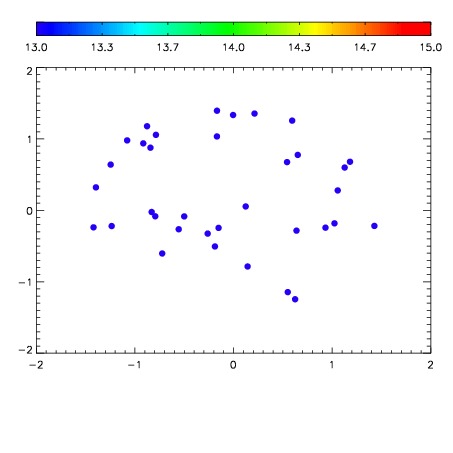

| Frame | Nreads | Zeropoints | Mag plots | Spatial mag deviation | Spatial sky 16325A emission deviations (filled: sky, open: star) | Spatial sky continuum emission | Spatial sky telluric CO2 absorption deviations (filled: H < 10) | |||||||||||||||||||||||
| 0 | 0 |
|
|
|
|
|
|
| IPAIR | NAME | SHIFT | NEWSHIFT | S/N | NAME | SHIFT | NEWSHIFT | S/N |
| 0 | 15600058 | 0.00000 | 0.00000 | 18.9020 | 15600063 | -0.490484 | 0.490484 | 18.8840 |
| 1 | 15600065 | -0.00144574 | 0.00144574 | 18.9245 | 15600064 | -0.490789 | 0.490789 | 18.9329 |
| 2 | 15600062 | -0.000351963 | 0.000351963 | 18.8536 | 15600060 | -0.491435 | 0.491435 | 18.8189 |
| 3 | 15600061 | -0.000436409 | 0.000436409 | 18.6257 | 15600059 | -0.491305 | 0.491305 | 18.7869 |