| Red | Green | Blue | |
| z | 17.64 | ||
| znorm | Inf | ||
| sky | -Inf | -Inf | -Inf |
| S/N | 37.3 | 58.2 | 67.7 |
| S/N(c) | 18.0 | 57.7 | 23.4 |
| SN(E/C) |
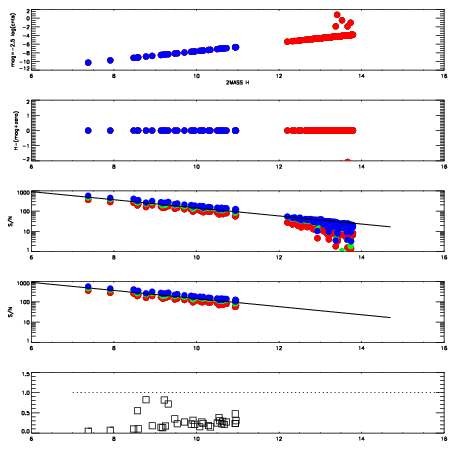

| Frame | Nreads | Zeropoints | Mag plots | Spatial mag deviation | Spatial sky 16325A emission deviations (filled: sky, open: star) | Spatial sky continuum emission | Spatial sky telluric CO2 absorption deviations (filled: H < 10) | |||||||||||||||||||||||
| 0 | 0 |
|
|
|
|
|
|
| IPAIR | NAME | SHIFT | NEWSHIFT | S/N | NAME | SHIFT | NEWSHIFT | S/N |
| 0 | 15890036 | 0.490490 | 0.00000 | 18.8336 | 15890042 | 0.00119451 | 0.489295 | 18.8126 |
| 1 | 15890039 | 0.488925 | 0.00156498 | 18.8803 | 15890037 | 0.000657265 | 0.489833 | 18.9284 |
| 2 | 15890035 | 0.489910 | 0.000579983 | 18.8705 | 15890038 | 0.000192960 | 0.490297 | 18.9182 |
| 3 | 15890044 | 0.489340 | 0.00114998 | 18.7542 | 15890045 | 0.00137380 | 0.489116 | 18.7874 |
| 4 | 15890043 | 0.489079 | 0.00141099 | 18.7135 | 15890034 | 0.00000 | 0.490490 | 18.7586 |
| 5 | 15890040 | 0.490028 | 0.000461996 | 18.6994 | 15890041 | 0.00144898 | 0.489041 | 18.6697 |