| Red | Green | Blue | |
| z | 17.64 | ||
| znorm | Inf | ||
| sky | -Inf | -Inf | -NaN |
| S/N | 32.4 | 45.6 | 56.7 |
| S/N(c) | 15.5 | 48.7 | 67.9 |
| SN(E/C) |
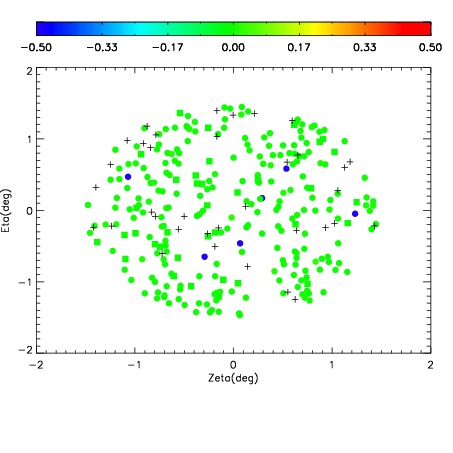


| Frame | Nreads | Zeropoints | Mag plots | Spatial mag deviation | Spatial sky 16325A emission deviations (filled: sky, open: star) | Spatial sky continuum emission | Spatial sky telluric CO2 absorption deviations (filled: H < 10) | |||||||||||||||||||||||
| 0 | 0 |
|
|
|
|
|
|
| IPAIR | NAME | SHIFT | NEWSHIFT | S/N | NAME | SHIFT | NEWSHIFT | S/N |
| 0 | 16060028 | 0.489746 | 0.00000 | 18.9666 | 16060026 | 0.00211023 | 0.487636 | 18.9444 |
| 1 | 16060027 | 0.488448 | 0.00129801 | 18.9796 | 16060029 | 0.00487701 | 0.484869 | 18.9450 |
| 2 | 16060024 | 0.487854 | 0.00189200 | 18.8946 | 16060022 | 0.00000 | 0.489746 | 18.7207 |
| 3 | 16060023 | 0.487521 | 0.00222501 | 18.8946 | 16060025 | 0.00204681 | 0.487699 | 18.6479 |