| Red | Green | Blue | |
| z | 17.64 | ||
| znorm | Inf | ||
| sky | -Inf | -Inf | -Inf |
| S/N | 35.1 | 49.2 | 62.7 |
| S/N(c) | 33.1 | 56.9 | 27.1 |
| SN(E/C) |
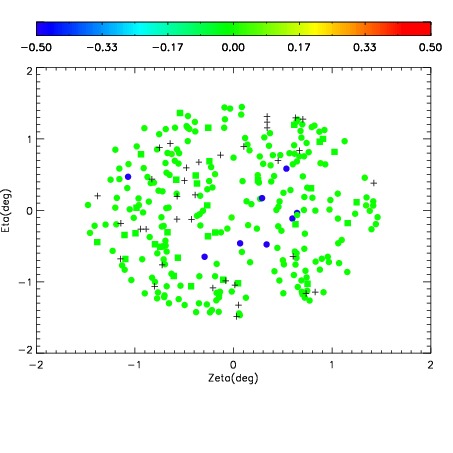
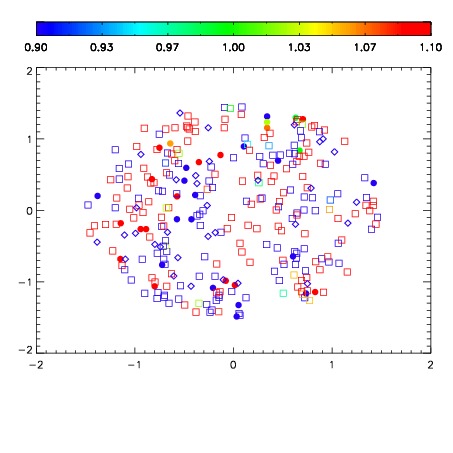
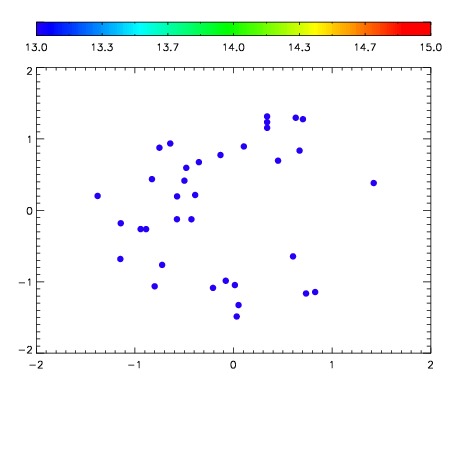

| Frame | Nreads | Zeropoints | Mag plots | Spatial mag deviation | Spatial sky 16325A emission deviations (filled: sky, open: star) | Spatial sky continuum emission | Spatial sky telluric CO2 absorption deviations (filled: H < 10) | |||||||||||||||||||||||
| 0 | 0 |
|
|
|
|
|
|
| IPAIR | NAME | SHIFT | NEWSHIFT | S/N | NAME | SHIFT | NEWSHIFT | S/N |
| 0 | 15590065 | 0.00292485 | 0.00000 | 18.9774 | 15590063 | -0.486749 | 0.489674 | 18.9608 |
| 1 | 15590061 | 0.000578993 | 0.00234586 | 18.9797 | 15590064 | -0.486388 | 0.489313 | 18.9909 |
| 2 | 15590062 | 0.00242528 | 0.000499570 | 18.9764 | 15590060 | -0.488445 | 0.491370 | 18.9287 |
| 3 | 15590058 | 0.00000 | 0.00292485 | 18.7535 | 15590059 | -0.488079 | 0.491004 | 18.7840 |