| Red | Green | Blue | |
| z | 17.64 | ||
| znorm | Inf | ||
| sky | -Inf | -Inf | -Inf |
| S/N | 23.9 | 38.2 | 44.8 |
| S/N(c) | 11.6 | 37.5 | 44.4 |
| SN(E/C) |
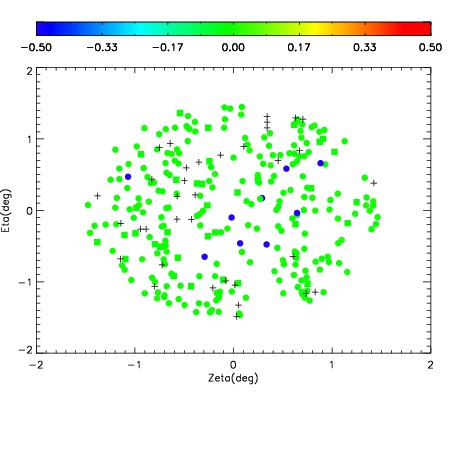
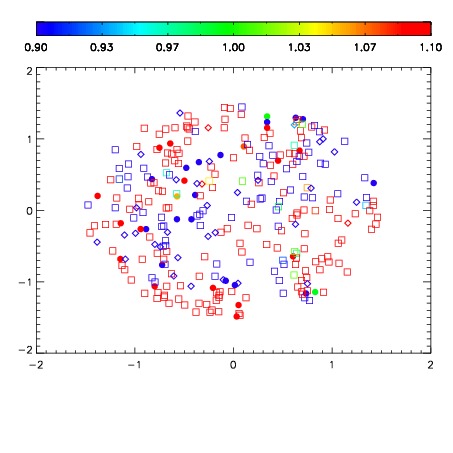
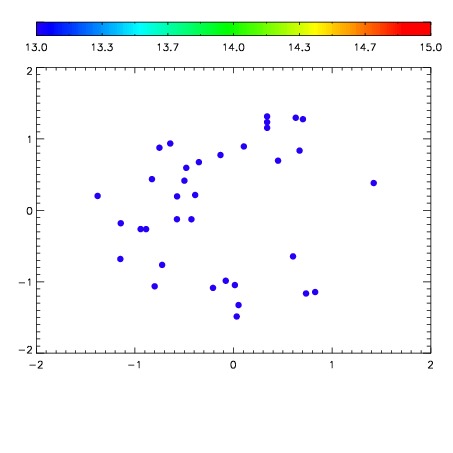

| Frame | Nreads | Zeropoints | Mag plots | Spatial mag deviation | Spatial sky 16325A emission deviations (filled: sky, open: star) | Spatial sky continuum emission | Spatial sky telluric CO2 absorption deviations (filled: H < 10) | |||||||||||||||||||||||
| 0 | 0 |
|
|
|
|
|
|
| IPAIR | NAME | SHIFT | NEWSHIFT | S/N | NAME | SHIFT | NEWSHIFT | S/N |
| 0 | 16070028 | 0.492775 | 0.00000 | 18.1573 | 16070029 | 0.00261321 | 0.490162 | 18.1274 |
| 1 | 16070024 | 0.492728 | 4.69983e-05 | 18.5285 | 16070022 | 0.00000 | 0.492775 | 18.6256 |
| 2 | 16070027 | 0.492260 | 0.000514984 | 18.3335 | 16070025 | 0.00268794 | 0.490087 | 18.4919 |
| 3 | 16070023 | 0.492570 | 0.000204980 | 18.2845 | 16070026 | 0.00280928 | 0.489966 | 18.3076 |