| Red | Green | Blue | |
| z | 17.64 | ||
| znorm | Inf | ||
| sky | -Inf | -Inf | -Inf |
| S/N | 8.3 | 13.3 | 17.4 |
| S/N(c) | 4.2 | 14.4 | 19.5 |
| SN(E/C) |
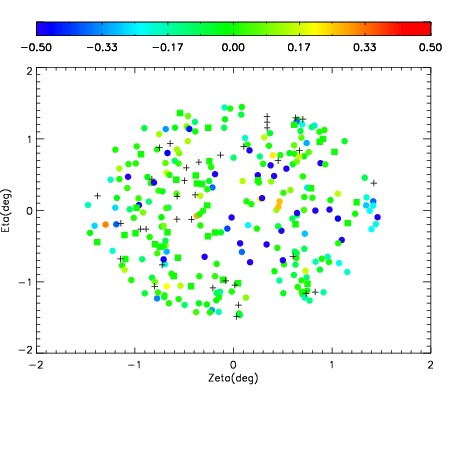
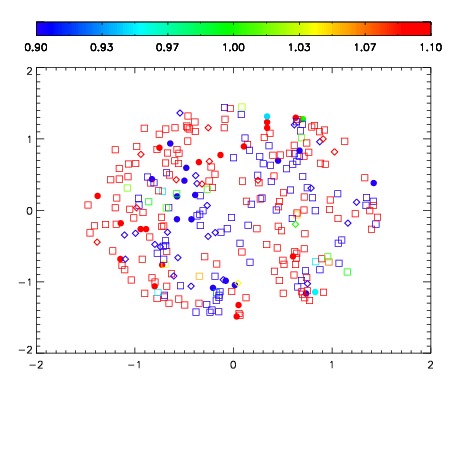
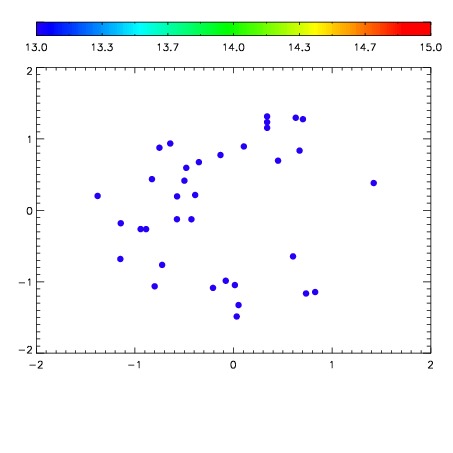

| Frame | Nreads | Zeropoints | Mag plots | Spatial mag deviation | Spatial sky 16325A emission deviations (filled: sky, open: star) | Spatial sky continuum emission | Spatial sky telluric CO2 absorption deviations (filled: H < 10) | |||||||||||||||||||||||
| 0 | 0 |
|
|
|
|
|
|
| IPAIR | NAME | SHIFT | NEWSHIFT | S/N | NAME | SHIFT | NEWSHIFT | S/N |
| 0 | 16100024 | 0.498737 | 0.00000 | 16.9062 | 16100022 | 0.00000 | 0.498737 | 16.8445 |
| 1 | 16100023 | 0.498199 | 0.000538021 | 17.5264 | 16100025 | 0.00152127 | 0.497216 | 17.8016 |