| Red | Green | Blue | |
| z | 17.64 | ||
| znorm | Inf | ||
| sky | -Inf | -Inf | -Inf |
| S/N | 35.1 | 49.4 | 62.2 |
| S/N(c) | 35.6 | 53.6 | 28.5 |
| SN(E/C) |

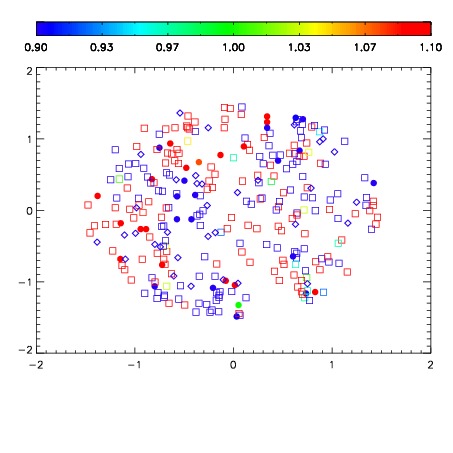
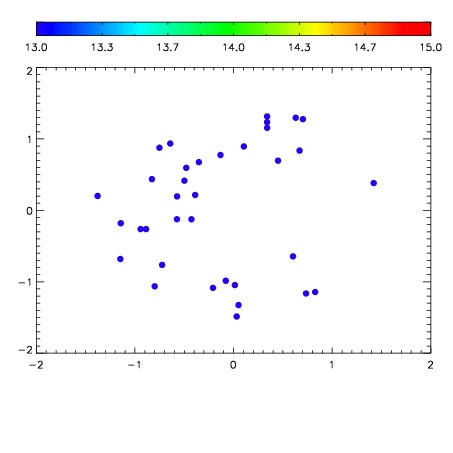

| Frame | Nreads | Zeropoints | Mag plots | Spatial mag deviation | Spatial sky 16325A emission deviations (filled: sky, open: star) | Spatial sky continuum emission | Spatial sky telluric CO2 absorption deviations (filled: H < 10) | |||||||||||||||||||||||
| 0 | 0 |
|
|
|
|
|
|
| IPAIR | NAME | SHIFT | NEWSHIFT | S/N | NAME | SHIFT | NEWSHIFT | S/N |
| 0 | 16130024 | 0.497175 | 0.00000 | 18.9597 | 16130018 | 0.00000 | 0.497175 | 19.0184 |
| 1 | 16130019 | 0.493654 | 0.00352100 | 19.0299 | 16130021 | -0.000126757 | 0.497302 | 19.0698 |
| 2 | 16130020 | 0.494755 | 0.00242001 | 19.0174 | 16130022 | 0.000336660 | 0.496838 | 19.0542 |
| 3 | 16130023 | 0.497154 | 2.10106e-05 | 18.9557 | 16130025 | 0.00186671 | 0.495308 | 18.8722 |