| Red | Green | Blue | |
| z | 17.64 | ||
| znorm | Inf | ||
| sky | -Inf | -Inf | -Inf |
| S/N | 26.2 | 39.2 | 51.7 |
| S/N(c) | 27.1 | 41.3 | 57.4 |
| SN(E/C) |
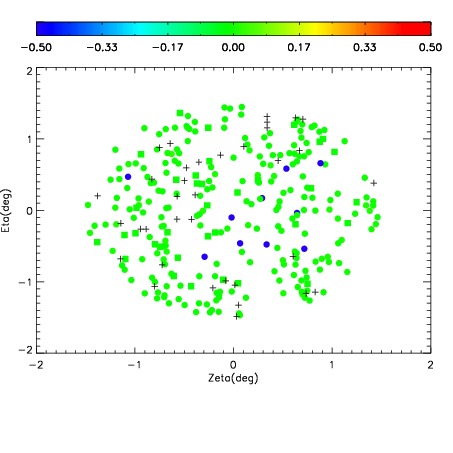
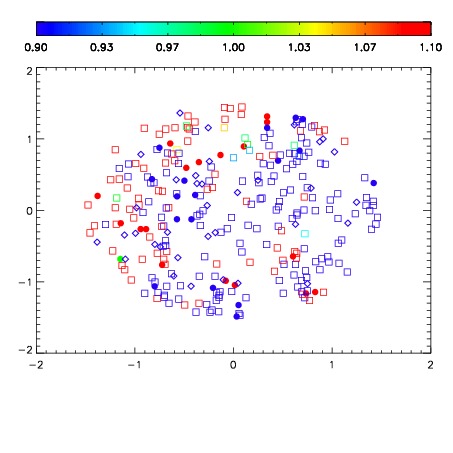


| Frame | Nreads | Zeropoints | Mag plots | Spatial mag deviation | Spatial sky 16325A emission deviations (filled: sky, open: star) | Spatial sky continuum emission | Spatial sky telluric CO2 absorption deviations (filled: H < 10) | |||||||||||||||||||||||
| 0 | 0 |
|
|
|
|
|
|
| IPAIR | NAME | SHIFT | NEWSHIFT | S/N | NAME | SHIFT | NEWSHIFT | S/N |
| 0 | 18490085 | 0.505324 | 0.00000 | 18.5826 | 18490084 | 0.00000 | 0.505324 | 18.7893 |
| 1 | 18490089 | 0.504507 | 0.000817001 | 18.7956 | 18490091 | 0.000562737 | 0.504761 | 18.8040 |
| 2 | 18490090 | 0.504454 | 0.000869989 | 18.4307 | 18490088 | 0.000647101 | 0.504677 | 18.4314 |
| 3 | 18490086 | 0.504894 | 0.000429988 | 18.0885 | 18490087 | 0.000499224 | 0.504825 | 17.9495 |