| Red | Green | Blue | |
| z | 17.65 | ||
| znorm | Inf | ||
| sky | -Inf | -Inf | -Inf |
| S/N | 26.2 | 37.9 | 49.8 |
| S/N(c) | 27.5 | 47.3 | 24.1 |
| SN(E/C) |
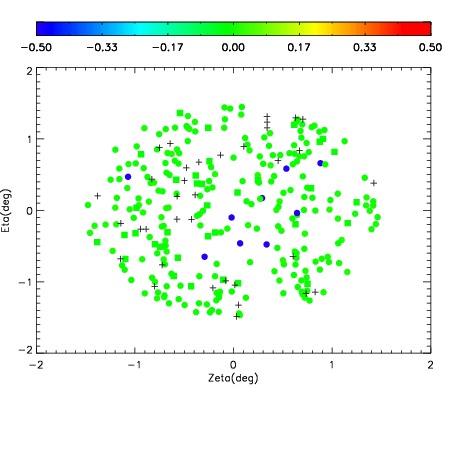
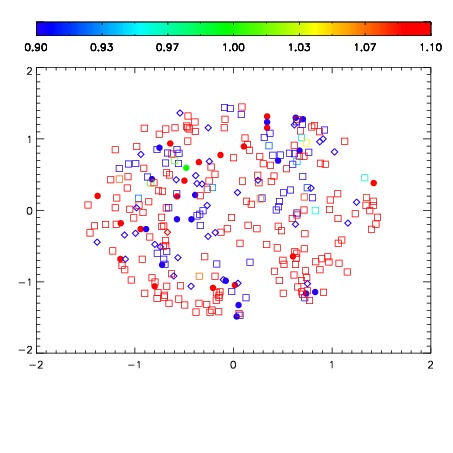
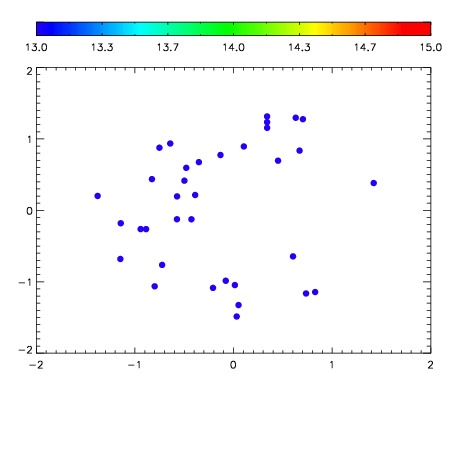

| Frame | Nreads | Zeropoints | Mag plots | Spatial mag deviation | Spatial sky 16325A emission deviations (filled: sky, open: star) | Spatial sky continuum emission | Spatial sky telluric CO2 absorption deviations (filled: H < 10) | |||||||||||||||||||||||
| 0 | 0 |
|
|
|
|
|
|
| IPAIR | NAME | SHIFT | NEWSHIFT | S/N | NAME | SHIFT | NEWSHIFT | S/N |
| 0 | 18520058 | 0.00000 | 0.00000 | 18.7118 | 18520060 | -0.494364 | 0.494364 | 18.7551 |
| 1 | 18520062 | -0.000366297 | 0.000366297 | 18.8707 | 18520063 | -0.494461 | 0.494461 | 18.9024 |
| 2 | 18520061 | -0.00114218 | 0.00114218 | 18.8008 | 18520059 | -0.494452 | 0.494452 | 18.7603 |