| Red | Green | Blue | |
| z | 17.64 | ||
| znorm | Inf | ||
| sky | -Inf | -Inf | -NaN |
| S/N | 14.5 | 28.8 | 30.8 |
| S/N(c) | 42.6 | 25.3 | 72.4 |
| SN(E/C) |
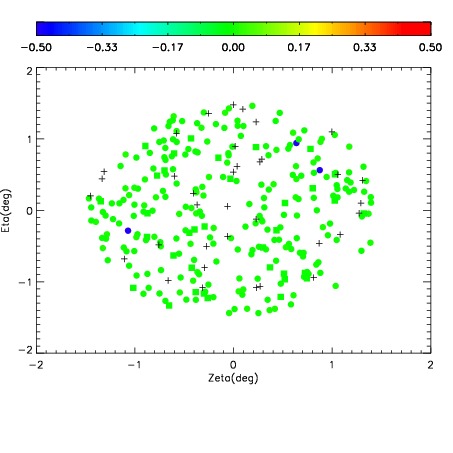
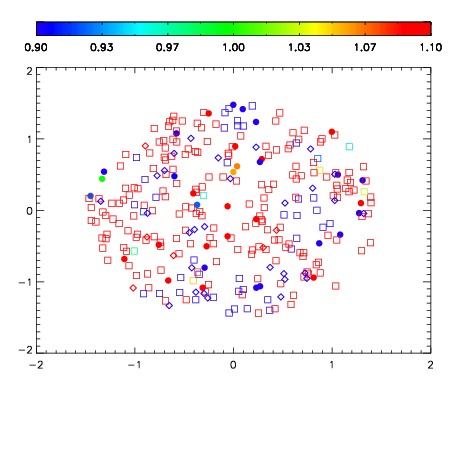
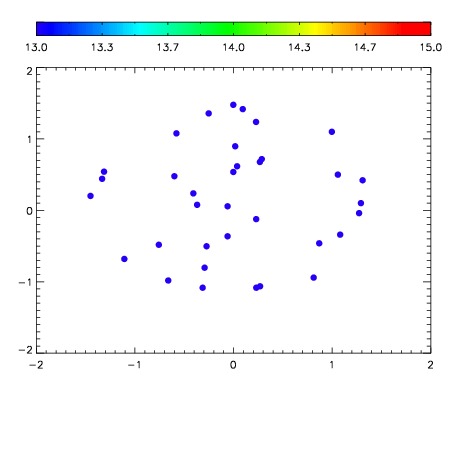

| Frame | Nreads | Zeropoints | Mag plots | Spatial mag deviation | Spatial sky 16325A emission deviations (filled: sky, open: star) | Spatial sky continuum emission | Spatial sky telluric CO2 absorption deviations (filled: H < 10) | |||||||||||||||||||||||
| 0 | 0 |
|
|
|
|
|
|
| IPAIR | NAME | SHIFT | NEWSHIFT | S/N | NAME | SHIFT | NEWSHIFT | S/N |
| 0 | 15250054 | 0.511105 | 0.00000 | 18.7112 | 15250048 | 0.00000 | 0.511105 | 18.7735 |
| 1 | 15250049 | 0.509921 | 0.00118399 | 18.7794 | 15250055 | 0.00204762 | 0.509057 | 18.8024 |
| 2 | 15250053 | 0.510388 | 0.000716984 | 18.7079 | 15250052 | 0.000771747 | 0.510333 | 18.7482 |
| 3 | 15250050 | 0.510212 | 0.000892997 | 18.7013 | 15250051 | 0.000700155 | 0.510405 | 18.6530 |