| Red | Green | Blue | |
| z | 17.64 | ||
| znorm | Inf | ||
| sky | -Inf | -NaN | -NaN |
| S/N | 19.7 | 38.3 | 41.1 |
| S/N(c) | 41.1 | 70.1 | 60.2 |
| SN(E/C) |
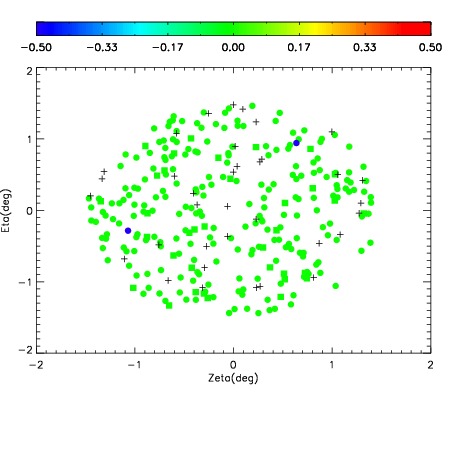
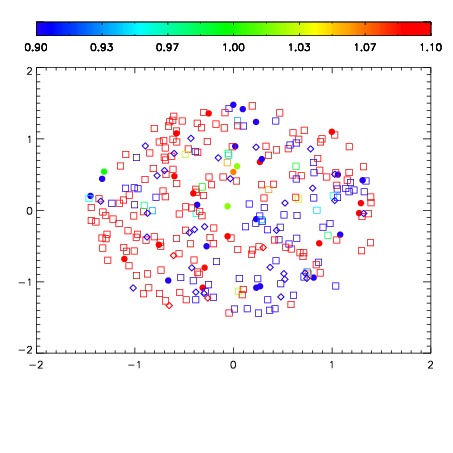
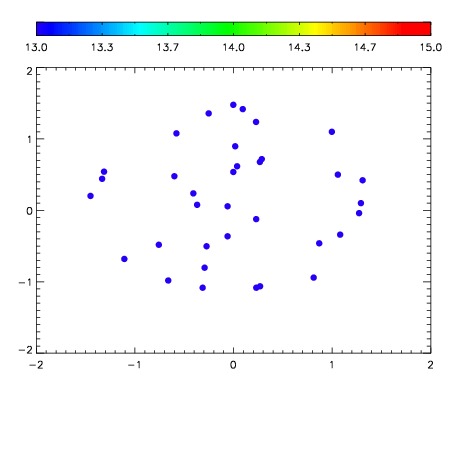

| Frame | Nreads | Zeropoints | Mag plots | Spatial mag deviation | Spatial sky 16325A emission deviations (filled: sky, open: star) | Spatial sky continuum emission | Spatial sky telluric CO2 absorption deviations (filled: H < 10) | |||||||||||||||||||||||
| 0 | 0 |
|
|
|
|
|
|
| IPAIR | NAME | SHIFT | NEWSHIFT | S/N | NAME | SHIFT | NEWSHIFT | S/N |
| 0 | 15310032 | 0.498372 | 0.00000 | 18.8261 | 15310029 | 0.00144837 | 0.496924 | 18.9187 |
| 1 | 15310027 | 0.497484 | 0.000887990 | 19.0719 | 15310026 | 0.00000 | 0.498372 | 19.0520 |
| 2 | 15310028 | 0.497694 | 0.000678003 | 19.0107 | 15310033 | 0.00273244 | 0.495640 | 18.9568 |
| 3 | 15310031 | 0.498075 | 0.000296980 | 18.9862 | 15310030 | 0.00147960 | 0.496892 | 18.9191 |