| Red | Green | Blue | |
| z | 17.64 | ||
| znorm | Inf | ||
| sky | -Inf | -Inf | -NaN |
| S/N | 19.3 | 35.1 | 38.5 |
| S/N(c) | 45.5 | 58.8 | 97.7 |
| SN(E/C) |
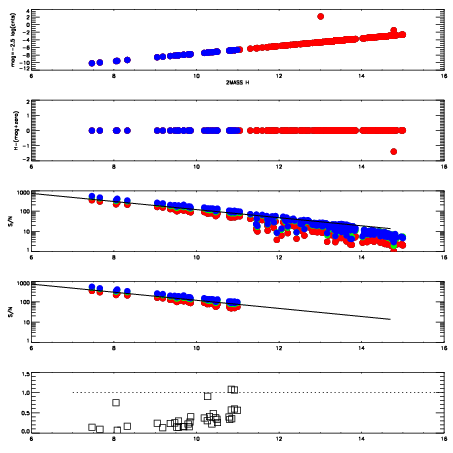
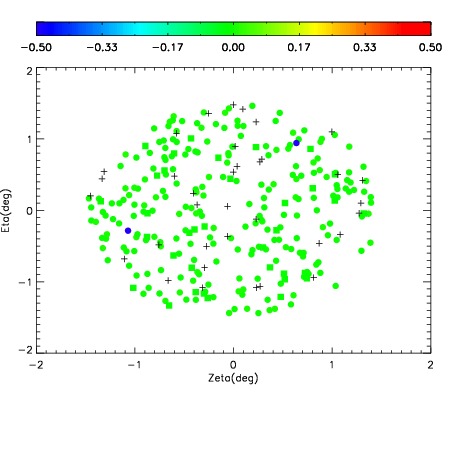
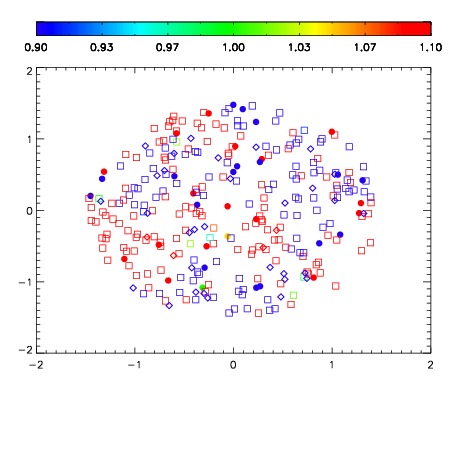
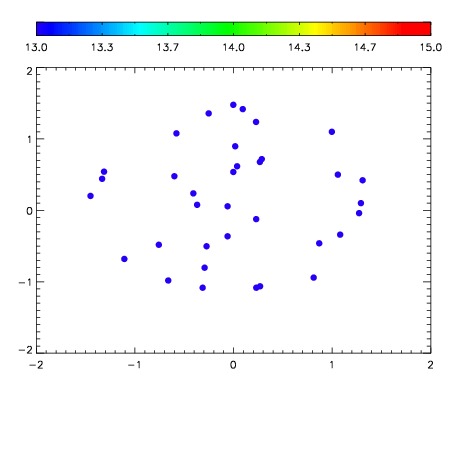

| Frame | Nreads | Zeropoints | Mag plots | Spatial mag deviation | Spatial sky 16325A emission deviations (filled: sky, open: star) | Spatial sky continuum emission | Spatial sky telluric CO2 absorption deviations (filled: H < 10) | |||||||||||||||||||||||
| 0 | 0 |
|
|
|
|
|
|
| IPAIR | NAME | SHIFT | NEWSHIFT | S/N | NAME | SHIFT | NEWSHIFT | S/N |
| 0 | 15530025 | 0.00000 | 0.00000 | 18.6808 | 15530026 | -0.492221 | 0.492221 | 18.9547 |
| 1 | 15530028 | -0.000499769 | 0.000499769 | 19.0503 | 15530027 | -0.492483 | 0.492483 | 19.0395 |
| 2 | 15530029 | -0.000200018 | 0.000200018 | 18.9899 | 15530030 | -0.493302 | 0.493302 | 18.9684 |
| 3 | 15530032 | -0.00142144 | 0.00142144 | 18.4173 | 15530031 | -0.493227 | 0.493227 | 18.7325 |