| Red | Green | Blue | |
| z | 17.64 | ||
| znorm | Inf | ||
| sky | -Inf | -Inf | -Inf |
| S/N | 20.1 | 36.8 | 38.8 |
| S/N(c) | 46.6 | 90.8 | 72.7 |
| SN(E/C) |
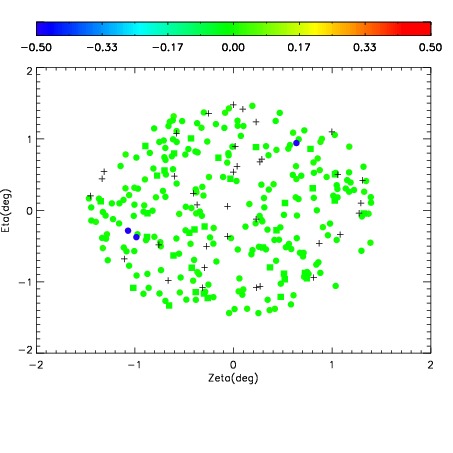
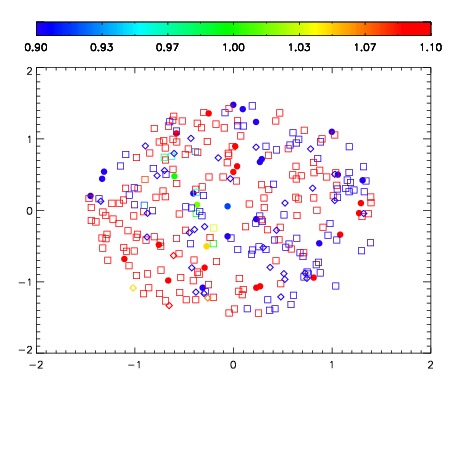
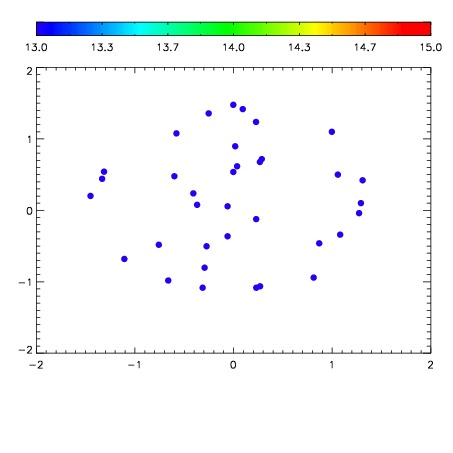

| Frame | Nreads | Zeropoints | Mag plots | Spatial mag deviation | Spatial sky 16325A emission deviations (filled: sky, open: star) | Spatial sky continuum emission | Spatial sky telluric CO2 absorption deviations (filled: H < 10) | |||||||||||||||||||||||
| 0 | 0 |
|
|
|
|
|
|
| IPAIR | NAME | SHIFT | NEWSHIFT | S/N | NAME | SHIFT | NEWSHIFT | S/N |
| 0 | 15570032 | 0.491644 | 0.00000 | 18.8734 | 15570033 | 0.00106003 | 0.490584 | 18.8656 |
| 1 | 15570028 | 0.491456 | 0.000187993 | 18.9386 | 15570029 | 0.000910862 | 0.490733 | 18.9644 |
| 2 | 15570027 | 0.491001 | 0.000642985 | 18.9096 | 15570030 | 0.000898192 | 0.490746 | 18.9605 |
| 3 | 15570031 | 0.490788 | 0.000855982 | 18.9043 | 15570026 | 0.00000 | 0.491644 | 18.9548 |