| Red | Green | Blue | |
| z | 17.64 | ||
| znorm | Inf | ||
| sky | -Inf | -NaN | -NaN |
| S/N | 21.1 | 39.0 | 42.2 |
| S/N(c) | 42.0 | 74.1 | 57.9 |
| SN(E/C) |
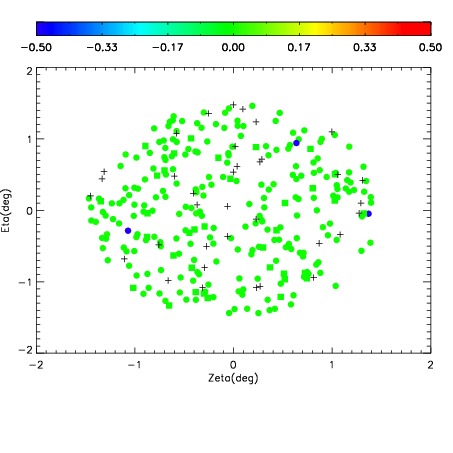
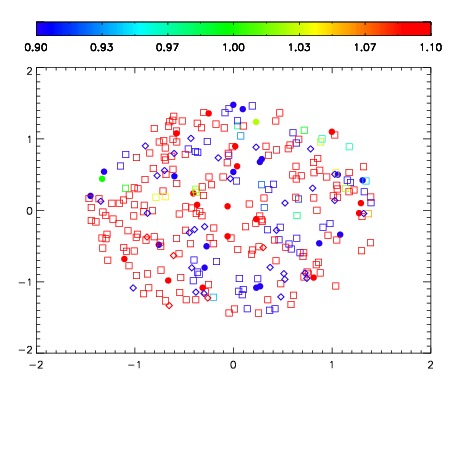
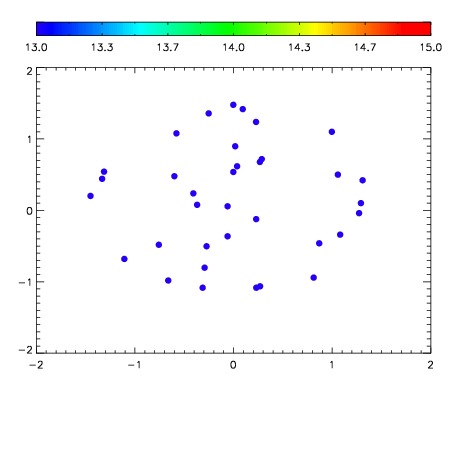

| Frame | Nreads | Zeropoints | Mag plots | Spatial mag deviation | Spatial sky 16325A emission deviations (filled: sky, open: star) | Spatial sky continuum emission | Spatial sky telluric CO2 absorption deviations (filled: H < 10) | |||||||||||||||||||||||
| 0 | 0 |
|
|
|
|
|
|
| IPAIR | NAME | SHIFT | NEWSHIFT | S/N | NAME | SHIFT | NEWSHIFT | S/N |
| 0 | 15800018 | 0.486146 | 0.00000 | 19.0119 | 15800019 | 0.00198229 | 0.484164 | 19.0110 |
| 1 | 15800014 | 0.485482 | 0.000663996 | 19.0179 | 15800015 | 0.000542241 | 0.485604 | 19.0319 |
| 2 | 15800017 | 0.486136 | 1.00136e-05 | 18.9678 | 15800016 | 0.000588316 | 0.485558 | 18.9878 |
| 3 | 15800013 | 0.484983 | 0.00116301 | 18.9432 | 15800012 | 0.00000 | 0.486146 | 18.8074 |