| Red | Green | Blue | |
| z | 17.64 | ||
| znorm | Inf | ||
| sky | -Inf | -NaN | -NaN |
| S/N | 20.8 | 37.8 | 39.7 |
| S/N(c) | 19.5 | 22.8 | 48.7 |
| SN(E/C) |
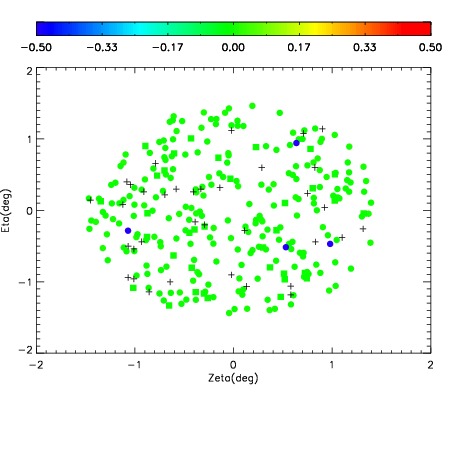
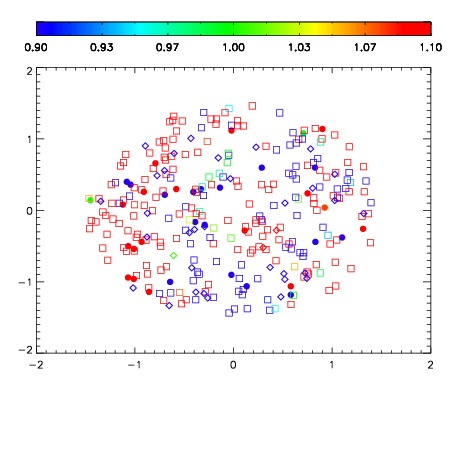
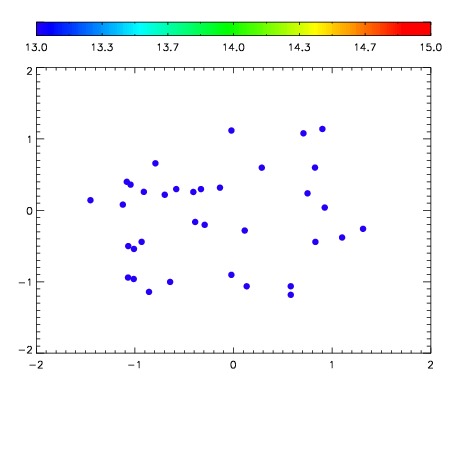

| Frame | Nreads | Zeropoints | Mag plots | Spatial mag deviation | Spatial sky 16325A emission deviations (filled: sky, open: star) | Spatial sky continuum emission | Spatial sky telluric CO2 absorption deviations (filled: H < 10) | |||||||||||||||||||||||
| 0 | 0 |
|
|
|
|
|
|
| IPAIR | NAME | SHIFT | NEWSHIFT | S/N | NAME | SHIFT | NEWSHIFT | S/N |
| 0 | 15810029 | 0.487239 | 0.00000 | 19.0113 | 15810028 | 0.00167749 | 0.485562 | 19.0182 |
| 1 | 15810025 | 0.485758 | 0.00148100 | 19.0523 | 15810024 | 0.00000 | 0.487239 | 19.0763 |
| 2 | 15810026 | 0.486197 | 0.00104201 | 19.0246 | 15810027 | 0.00137818 | 0.485861 | 19.0460 |
| 3 | 15810030 | 0.487186 | 5.29885e-05 | 18.9061 | 15810031 | 0.00171570 | 0.485523 | 18.9366 |