| Red | Green | Blue | |
| z | 17.64 | ||
| znorm | Inf | ||
| sky | -Inf | -Inf | -NaN |
| S/N | 14.8 | 26.6 | 27.2 |
| S/N(c) | 17.0 | 20.4 | 42.0 |
| SN(E/C) |
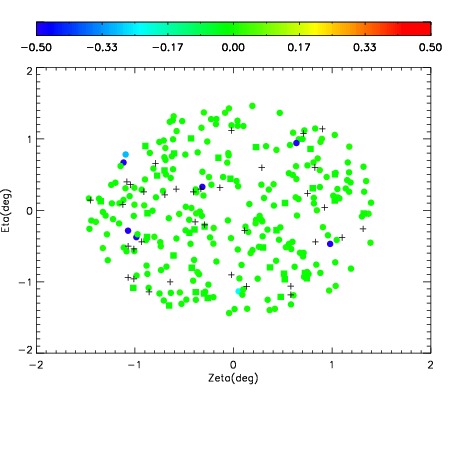
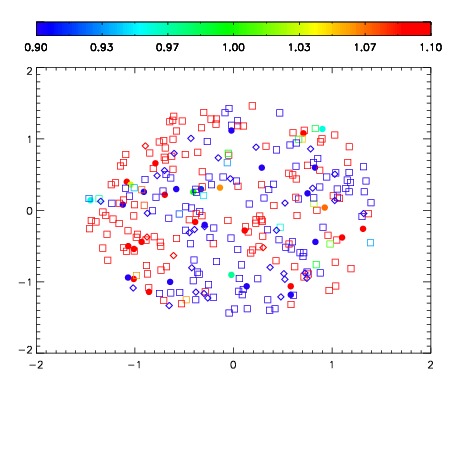


| Frame | Nreads | Zeropoints | Mag plots | Spatial mag deviation | Spatial sky 16325A emission deviations (filled: sky, open: star) | Spatial sky continuum emission | Spatial sky telluric CO2 absorption deviations (filled: H < 10) | |||||||||||||||||||||||
| 0 | 0 |
|
|
|
|
|
|
| IPAIR | NAME | SHIFT | NEWSHIFT | S/N | NAME | SHIFT | NEWSHIFT | S/N |
| 0 | 16070013 | 0.488385 | 0.00000 | 18.7360 | 16070018 | -0.00369433 | 0.492079 | 18.7860 |
| 1 | 16070012 | 0.487865 | 0.000519991 | 18.7022 | 16070011 | 0.00000 | 0.488385 | 18.7826 |
| 2 | 16070017 | 0.487160 | 0.00122499 | 18.6924 | 16070014 | -0.00181537 | 0.490200 | 18.7607 |
| 3 | 16070016 | 0.486479 | 0.00190598 | 18.5513 | 16070015 | -0.00227558 | 0.490661 | 18.5921 |