| Red | Green | Blue | |
| z | 17.64 | ||
| znorm | Inf | ||
| sky | -Inf | -Inf | -NaN |
| S/N | 4.1 | 7.6 | 7.9 |
| S/N(c) | 4.8 | 6.0 | 11.8 |
| SN(E/C) |
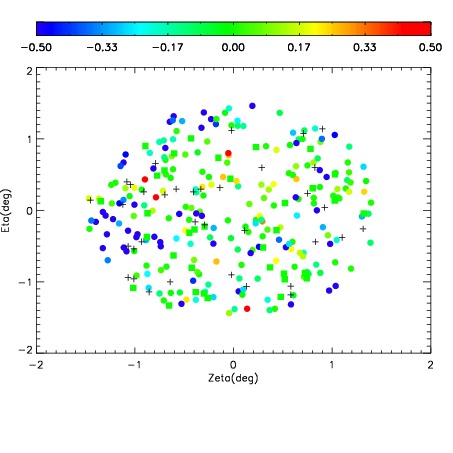
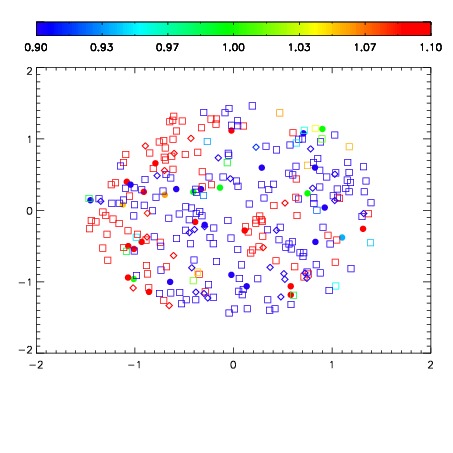
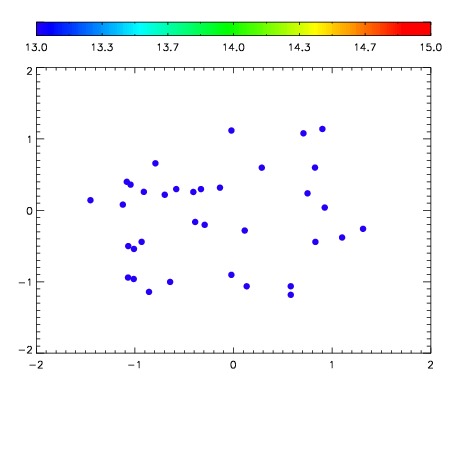

| Frame | Nreads | Zeropoints | Mag plots | Spatial mag deviation | Spatial sky 16325A emission deviations (filled: sky, open: star) | Spatial sky continuum emission | Spatial sky telluric CO2 absorption deviations (filled: H < 10) | |||||||||||||||||||||||
| 0 | 0 |
|
|
|
|
|
|
| IPAIR | NAME | SHIFT | NEWSHIFT | S/N | NAME | SHIFT | NEWSHIFT | S/N |
| 0 | 16080012 | 0.490625 | 0.00000 | 18.1260 | 16080011 | 0.00000 | 0.490625 | 17.5762 |
| 1 | 16080013 | 0.490583 | 4.19915e-05 | 16.1008 | 16080014 | 0.000388163 | 0.490237 | 14.9144 |