| Red | Green | Blue | |
| z | 17.64 | ||
| znorm | Inf | ||
| sky | -Inf | -Inf | -NaN |
| S/N | 17.5 | 34.5 | 39.2 |
| S/N(c) | 28.1 | 26.8 | 42.0 |
| SN(E/C) |
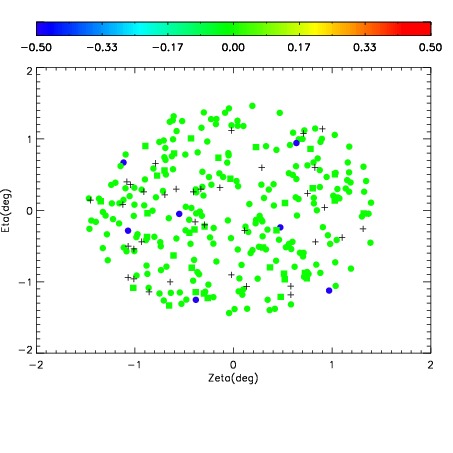
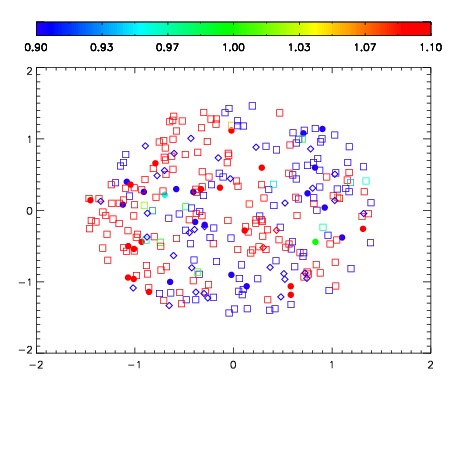
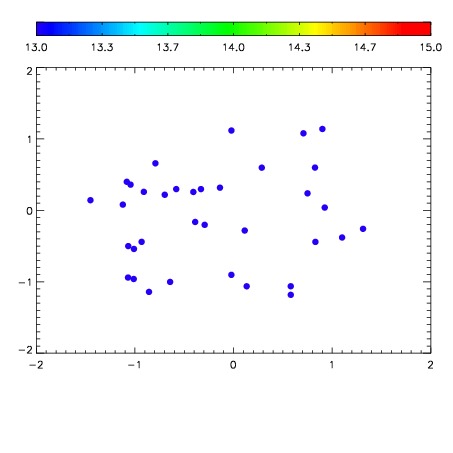

| Frame | Nreads | Zeropoints | Mag plots | Spatial mag deviation | Spatial sky 16325A emission deviations (filled: sky, open: star) | Spatial sky continuum emission | Spatial sky telluric CO2 absorption deviations (filled: H < 10) | |||||||||||||||||||||||
| 0 | 0 |
|
|
|
|
|
|
| IPAIR | NAME | SHIFT | NEWSHIFT | S/N | NAME | SHIFT | NEWSHIFT | S/N |
| 0 | 18270054 | 0.000405650 | 0.00000 | 19.0960 | 18270059 | -0.505725 | 0.506131 | 19.0882 |
| 1 | 18270058 | -0.00179947 | 0.00220512 | 19.1080 | 18270056 | -0.505815 | 0.506221 | 19.0973 |
| 2 | 18270053 | 0.000215736 | 0.000189914 | 19.0885 | 18270052 | -0.504737 | 0.505143 | 19.0859 |
| 3 | 18270050 | 0.00000 | 0.000405650 | 19.0821 | 18270055 | -0.506216 | 0.506622 | 19.0839 |
| 4 | 18270057 | -0.00209231 | 0.00249796 | 19.0661 | 18270051 | -0.504921 | 0.505327 | 19.0573 |