| Red | Green | Blue | |
| z | 17.64 | ||
| znorm | Inf | ||
| sky | -Inf | -NaN | -Inf |
| S/N | 15.1 | 28.5 | 32.1 |
| S/N(c) | 16.4 | 19.4 | 55.6 |
| SN(E/C) |
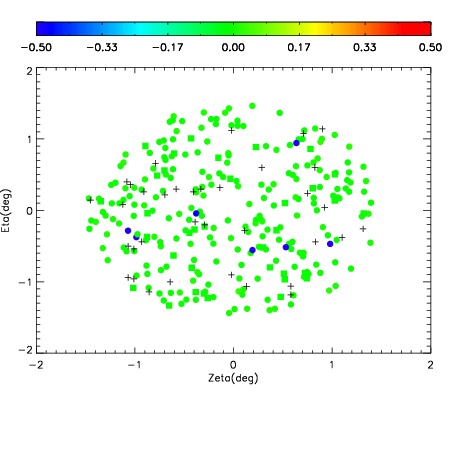

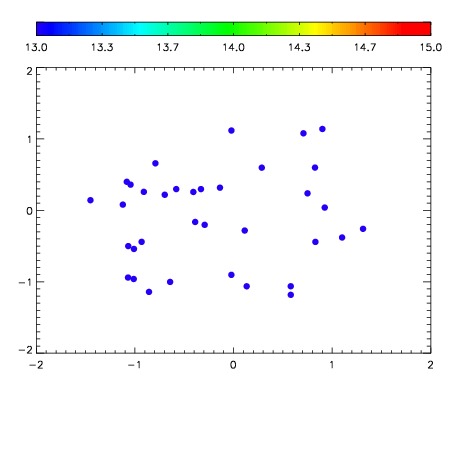

| Frame | Nreads | Zeropoints | Mag plots | Spatial mag deviation | Spatial sky 16325A emission deviations (filled: sky, open: star) | Spatial sky continuum emission | Spatial sky telluric CO2 absorption deviations (filled: H < 10) | |||||||||||||||||||||||
| 0 | 0 |
|
|
|
|
|
|
| IPAIR | NAME | SHIFT | NEWSHIFT | S/N | NAME | SHIFT | NEWSHIFT | S/N |
| 0 | 18470083 | 0.506024 | 0.00000 | 18.6826 | 18470080 | 0.00258869 | 0.503435 | 18.7486 |
| 1 | 18470082 | 0.505386 | 0.000638008 | 18.7642 | 18470084 | 0.00350228 | 0.502522 | 18.8019 |
| 2 | 18470078 | 0.505050 | 0.000974000 | 18.5899 | 18470081 | 0.00247469 | 0.503549 | 18.7481 |
| 3 | 18470079 | 0.505445 | 0.000579000 | 18.5801 | 18470077 | 0.00000 | 0.506024 | 18.2901 |