| Red | Green | Blue | |
| z | 17.64 | ||
| znorm | Inf | ||
| sky | -Inf | -Inf | -NaN |
| S/N | 20.8 | 38.6 | 42.7 |
| S/N(c) | 18.0 | 34.3 | 73.7 |
| SN(E/C) |
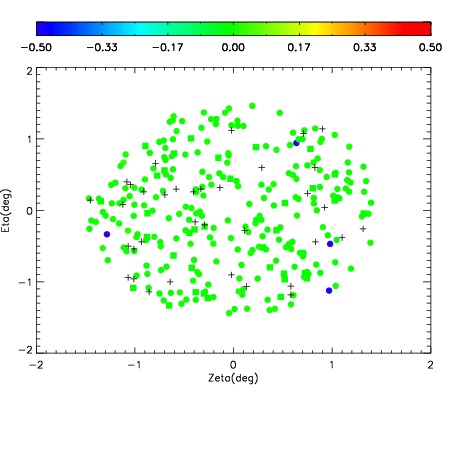
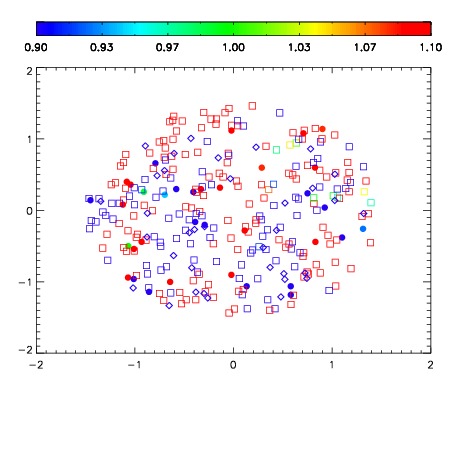


| Frame | Nreads | Zeropoints | Mag plots | Spatial mag deviation | Spatial sky 16325A emission deviations (filled: sky, open: star) | Spatial sky continuum emission | Spatial sky telluric CO2 absorption deviations (filled: H < 10) | |||||||||||||||||||||||
| 0 | 0 |
|
|
|
|
|
|
| IPAIR | NAME | SHIFT | NEWSHIFT | S/N | NAME | SHIFT | NEWSHIFT | S/N |
| 0 | 18530057 | 0.00192212 | 0.00000 | 19.1413 | 18530054 | -0.490425 | 0.492347 | 19.1072 |
| 1 | 18530056 | 0.00110648 | 0.000815640 | 19.1426 | 18530055 | -0.490287 | 0.492209 | 19.1417 |
| 2 | 18530053 | 0.000131543 | 0.00179058 | 19.1170 | 18530050 | -0.491701 | 0.493623 | 19.0908 |
| 3 | 18530052 | -0.000837721 | 0.00275984 | 19.0673 | 18530058 | -0.490176 | 0.492098 | 19.0854 |
| 4 | 18530049 | 0.00000 | 0.00192212 | 19.0495 | 18530051 | -0.491782 | 0.493704 | 19.0632 |