| Red | Green | Blue | |
| z | 17.64 | ||
| znorm | Inf | ||
| sky | -Inf | -Inf | -NaN |
| S/N | 19.5 | 36.8 | 41.5 |
| S/N(c) | 20.2 | 24.2 | 66.6 |
| SN(E/C) |
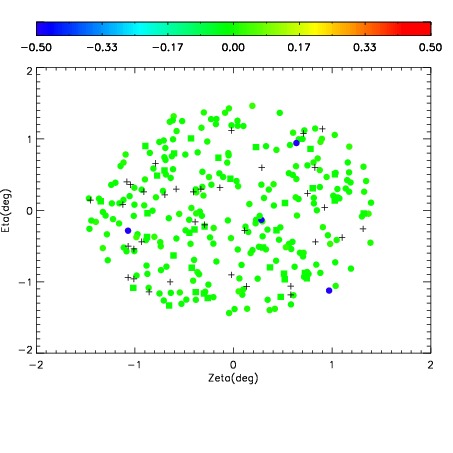
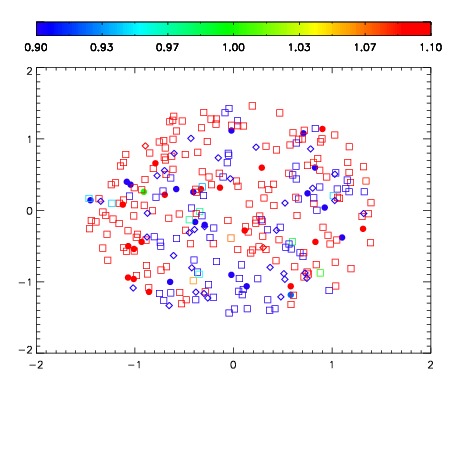
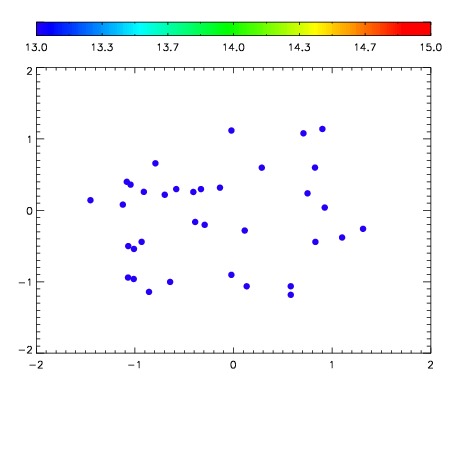

| Frame | Nreads | Zeropoints | Mag plots | Spatial mag deviation | Spatial sky 16325A emission deviations (filled: sky, open: star) | Spatial sky continuum emission | Spatial sky telluric CO2 absorption deviations (filled: H < 10) | |||||||||||||||||||||||
| 0 | 0 |
|
|
|
|
|
|
| IPAIR | NAME | SHIFT | NEWSHIFT | S/N | NAME | SHIFT | NEWSHIFT | S/N |
| 0 | 18740072 | 0.00231755 | 0.00000 | 18.9534 | 18740073 | -0.497348 | 0.499666 | 18.9555 |
| 1 | 18740071 | 0.00107903 | 0.00123852 | 18.9253 | 18740070 | -0.499872 | 0.502190 | 18.8614 |
| 2 | 18740068 | -2.89959e-05 | 0.00234655 | 18.8671 | 18740069 | -0.499980 | 0.502298 | 18.8126 |
| 3 | 18740064 | 0.00000 | 0.00231755 | 18.8267 | 18740065 | -0.504104 | 0.506422 | 18.7947 |
| 4 | 18740067 | -0.00105525 | 0.00337280 | 18.7706 | 18740066 | -0.503766 | 0.506084 | 18.7735 |