| Red | Green | Blue | |
| z | 17.64 | ||
| znorm | Inf | ||
| sky | -NaN | -NaN | -Inf |
| S/N | 24.9 | 39.9 | 46.7 |
| S/N(c) | 27.0 | 30.7 | 62.4 |
| SN(E/C) |
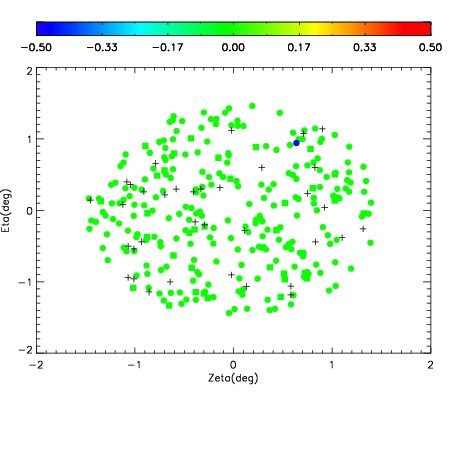
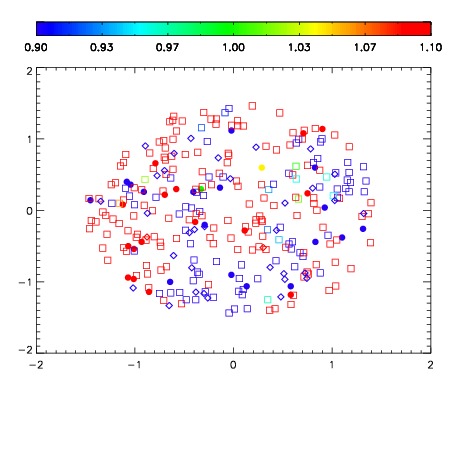
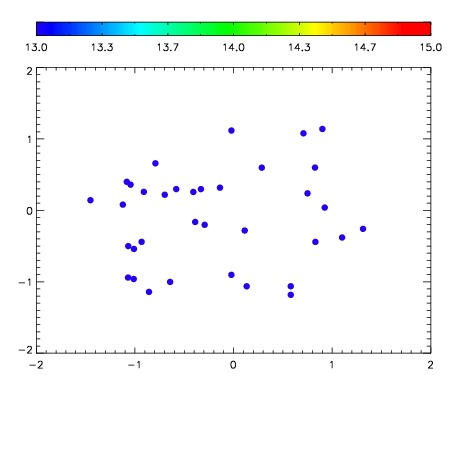

| Frame | Nreads | Zeropoints | Mag plots | Spatial mag deviation | Spatial sky 16325A emission deviations (filled: sky, open: star) | Spatial sky continuum emission | Spatial sky telluric CO2 absorption deviations (filled: H < 10) | |||||||||||||||||||||||
| 0 | 0 |
|
|
|
|
|
|
| IPAIR | NAME | SHIFT | NEWSHIFT | S/N | NAME | SHIFT | NEWSHIFT | S/N |
| 0 | 18810061 | 0.508064 | 0.00000 | 19.5628 | 18810055 | 0.00000 | 0.508064 | 19.4417 |
| 1 | 18810060 | 0.507742 | 0.000321984 | 19.6043 | 18810062 | 0.00246853 | 0.505595 | 19.5602 |
| 2 | 18810056 | 0.504626 | 0.00343800 | 19.5545 | 18810059 | 0.00506563 | 0.502998 | 19.4097 |
| 3 | 18810057 | 0.505928 | 0.00213599 | 19.3673 | 18810058 | 0.00387382 | 0.504190 | 19.3741 |