| Red | Green | Blue | |
| z | 17.64 | ||
| znorm | Inf | ||
| sky | -Inf | -Inf | -Inf |
| S/N | 19.0 | 34.1 | 36.6 |
| S/N(c) | 36.0 | 21.8 | 30.6 |
| SN(E/C) |
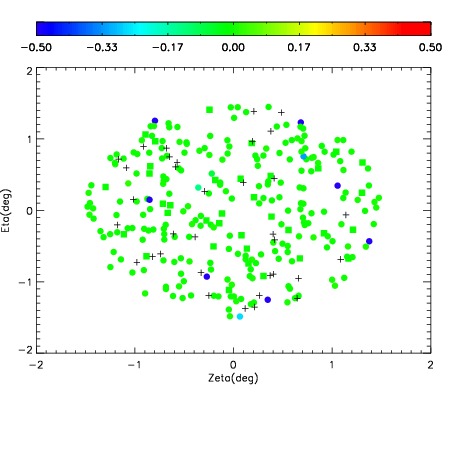
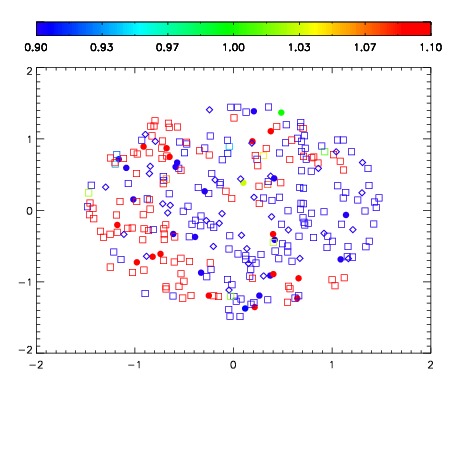
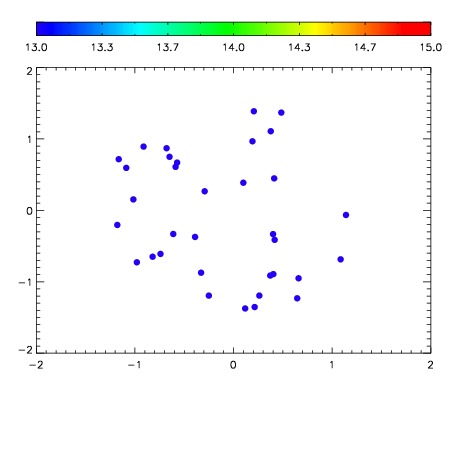

| Frame | Nreads | Zeropoints | Mag plots | Spatial mag deviation | Spatial sky 16325A emission deviations (filled: sky, open: star) | Spatial sky continuum emission | Spatial sky telluric CO2 absorption deviations (filled: H < 10) | |||||||||||||||||||||||
| 0 | 0 |
|
|
|
|
|
|
| IPAIR | NAME | SHIFT | NEWSHIFT | S/N | NAME | SHIFT | NEWSHIFT | S/N |
| 0 | 15290035 | 0.503002 | 0.00000 | 19.0913 | 15290033 | 0.00000 | 0.503002 | 19.0483 |
| 1 | 15290034 | 0.502545 | 0.000456989 | 19.0732 | 15290036 | -0.000119483 | 0.503121 | 18.9512 |